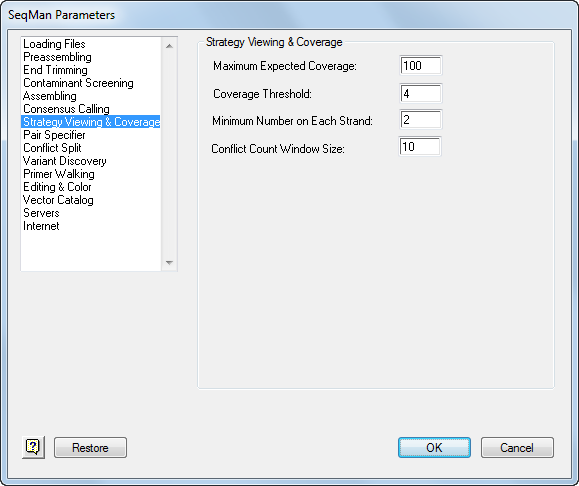
The Strategy Viewing & Coverage parameters determine how the Coverage Threshold and Conflicts graphics are constructed in the Strategy View, as well as the regions that are reported in the Coverage Report.
•Maximum Expected Coverage, the maximum number of reads that you expect in your assembly at any given position. After assembly, areas meeting or exceeding this maximum value will be indicated in the Strategy View by thick, red areas in the Coverage Threshold graph.
Note: The Maximum Expected Coverage value must be greater than the Coverage Threshold value.
•Coverage Threshold, the minimum number of reads covering every base in the consensus. For random sequencing projects, coverage of five to tenfold is commonly desired. However, if you are using SeqMan Pro’s Trace Evidence method to call the consensus, you may well achieve the accuracy you seek with coverage of only threefold. The default is 4.
•Minimum Number on Each Strand, the minimum number of reads covering every base in the consensus on each strand. The default value is 2. If a region in the alignment fails this minimum, it will be highlighted in the Contig Info window.
Note: Whichever values you choose here, the Coverage Threshold graph in the Strategy View shows thick green where coverage meets both the Coverage Threshold and Minimum Number on Each Strand criteria; thin green where both strands are covered but Coverage Threshold is not met; thin blue where coverage is on one strand only; and red where coverage is by a single read only.
•Conflict Count Window Size, the number of bases in the window used to calculate conflict score. The conflict score is displayed in the Conflicts graphic in the Strategy View. The default is 10.