Button Name
Icon
Description
Zoom in

Magnifies the Alignment View horizontally by 50% increments.
Zoom out

Reduces the Alignment View horizontally by 50% increments.
Normal view

Returns the Alignment View to its normal display after the Compact View option has been selected. (See below.)
Compact view

Hides sequence names and fits more sequences per line wherever possible in the Alignment View.
Show sequence bases in color

Adds background coloring behind each base in order to facilitate visual judgement of overall column alignment quality. Gray represents a gap, while other bases use the “Color by Chemistry” scheme also used in GenVision Pro and Protean 3D.
|
Nucleotide |
|
A |
|
C |
|
G |
|
T/U |
If you activate Show sequence bases in color and later press a Quality or SNP button (see below), their color schemes will temporarily replace this one. However, once you stop displaying quality scores or variants, the sequence bases will regain their colored backgrounds.
Amplitude control tool (Vertical squisher)

Lets you globally define the vertical amplitude of chromatograms. Drag the slide control up to reduce or down to increase the vertical area each chromatogram occupies.
Sequence anchors

Prior to correcting an alignment, use these buttons to see how the sequence is anchored. If the left anchor is active, residues left of the insertion point are held in place. If you insert any characters, the downstream sequence slides to the right. If you delete any bases, the downstream sequence fills in the gap by sliding left. If the right anchor is active, the reverse occurs.
Banana

If you want to change the alignment position of a whole sequence in your project, click this button, then click on a sequence. Slide the sequence by dragging to the left or right. When you perform this operation, the cursor icon changes to a Banana. Holding down the Alt key while dragging performs the same function as the Banana tool.
Quality buttons
This group of buttons lets you choose whether to view individual or averaged quality scores, or no scores at all. For additional information about quality scores, see Quality Score Calculations. Clicking the visible Quality button causes three auxiliary buttons to appear in a horizontal row. Whichever button you select determines the quality score display:

Does not display quality scores.

Displays individual SeqMan Pro quality scores. The quality score (Q) of a peak is calculated based on the shape and height of each peak and is adjusted relative to the maximum height of any peak in the entire sequence. Taller, sharper peaks receive the highest quality scores. The heights of any underlying peaks are subtracted from the highest peak’s score. For .fas files, SeqMan Pro automatically checks for .qual files with the same name in the same folder. These .qual files may come from SeqMan Pro or Phred, among other sources. If found, the quality values are displayed. Note that gaps are not assigned quality scores.

Displays SeqMan Pro quality scores averaged over a defined window. This mode is useful for examining trimming (see Trimming and Restoring Sequence Ends Manually). Note that gaps are not assigned quality scores.
Note: Quality scores with 3 or more digits may be appear as ** if there is insufficient room to display the entire value.

Displays imported quality scores, if available. This button is only available if you imported an assembly.
Note: If you are viewing an older project, a dialog may appear asking you to update quality scores. To do so, click Update.
SNP buttons
This group of buttons lets you choose whether to hide variants, view variants, or only display sequences that have variants. (For additional information about variants, see Discovering Variants.) Clicking the visible SNP button causes three auxiliary buttons to appear in a horizontal row. Whichever button you select determines the variant display in the Alignment View.

Variants are not displayed.

Variant bases are colored to distinguish variant from non-variant bases in reference and sample sequences.

Only sequences with variants are displayed.
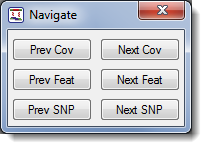
Navigate tool

Click the compass rose icon to open a search dialog. Click the buttons to find the next or previous single-sequence Cov(erage) area, Feat(ure) or SNP. Clicking Next (or Prev) Cov causes the cursor to stop at both the beginnings and ends of single-sequence coverage areas.