Note: A contig that is part of a scaffold will have the scaffold number appended to the contig name:
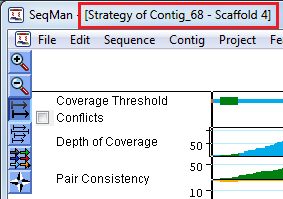
The Strategy View graphically summarizes the position and orientation of every constituent sequence in a contig or contig scaffold. When a single contig is selected, the view is named Strategy View; when a contig scaffold is selected, the view is named Scaffold Strategy View.
Note: A contig that is part of a scaffold will have the scaffold number appended to the contig name:
If paired end sequence data are present and recognized, the Strategy View also summarizes paired end sequence relationships.
To open the Strategy View, select a contig from the Project Summary window, and then select Contig > Strategy View.
To view all contigs in a scaffold, select a scaffold from the Project Summary window and then select Contig > Scaffold Strategy View.
Double-click on the Strategy View window anywhere along its length to open the Alignment View for the corresponding area. If the Alignment View is already open, clicking once on the Strategy View moves the cursor to the corresponding position in the Alignment View.
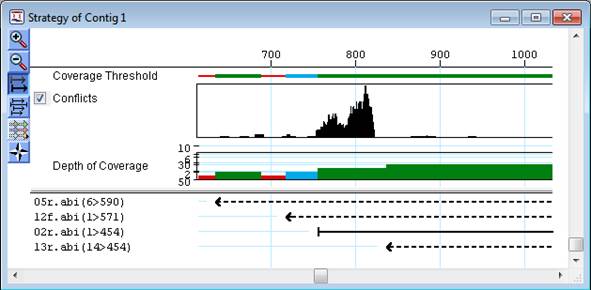
At the top of the Strategy View, underneath the ruler, several graphics are displayed:
•Coverage Threshold – Represents the coverage within the assembly as it compares to the threshold parameters defined under Strategy viewing parameters. For more information, see View Coverage.
•Conflicts – Represents how well the constituent sequences agree with the consensus. Note that the Conflicts graph will only be displayed when the box next to the word Conflicts is checked. For more information, see Displaying a Conflicts Graph.
•Depth of Coverage – Represents the depth of sequences throughout the assembly. The numbers to the left of the graph indicate the actual number of sequences represented. For more information, see View Coverage.
•Pair Consistency – Displays a summary of either split reads (for non-paired data) or good versus bad paired end sequence data content (for paired reads). For more information, see Viewing the Pair Consistency Graph.
•Features - If features are present on the consensus sequence, they will be displayed in the area labeled Features beneath the Depth of Coverage graph. Use the Features from drop-down menu to choose whether to display Consensus or Reference features. For more information, see Viewing Features in the Strategy View.

A list of constituent sequences is displayed in the bottom section of the view. Arrows graphically represent the individual sequences in the contig.
•The point of the arrowhead represents the 3’ end and the tail represents the 5’ end.
•Solid arrows pointing right represent sequences assigned to the top strand of the consensus sequence.
•Dash-lined arrows pointing left represent sequences assigned to the bottom (complementary) strand of the consensus sequence.
If paired-end data are present and correctly specified, arrows will be displayed using a color code. Note that paired-end data whose forward and reverse reads both have the same start positions are normally inferred to be clonal (i.e., duplicates) and duplicates are not displayed.
Right-click on an arrow or a sequence name to access the following context menu commands:
|
Command |
Shortcut to: |
|
Alignment View |
Alignment > Alignment View |
|
Contig Info |
Alignment > Contig Info |
|
Show Original Trace/Flowgram Data |
Sequence > Show Original Trace/Flowgram Data |
|
Show Seq Info |
Sequence > Show Seq Info |
Note: To use the Variant > Show/Hide Variants commands from the Strategy View, the Alignment View for the same contig must also be open. Similarly, to use these commands from the Scaffold Strategy View, you must have Alignment Views open for all contigs in the scaffold.