Note: The Flowgram window is disabled for BAM-based projects.
SeqMan Pro will display the flowgram and corresponding quality scores for each sequence within an .sff file.
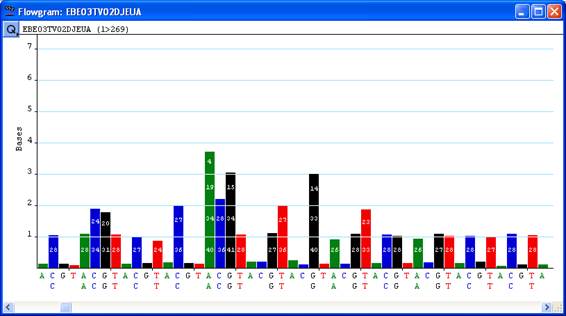
The flowgram display shows two rows of bases along the X-axis: the top row is a repeating series of ACGT and the bottom row shows each called base for the specified sequence. The values along the y-axis represent the number of bases for each called position. For example, in the image below, the 2nd instance of a called A will appear as 4 consecutive A’s in your sequence.
When quality scores are displayed, they appear within the colored bar for each called base. For bars that represent more than one base, the quality score for each consecutive base is listed in order of orientation from bottom to top.
If Quality trimming is turned on, SeqMan Pro will use the quality scores from the .sff file for end-trimming.
Note: See Specifying End Trimming for more information about quality end trimming.
You may view flowgram data for the sequences within your .sff file via the Unassembled Sequences window prior to assembly. Simply highlight the sequence(s) you wish to view, then select Sequence > Show Original Trace/Flowgram Data. Or, double-click on an individual sequence. The flowgram data for each sequence will be displayed in a separate window.
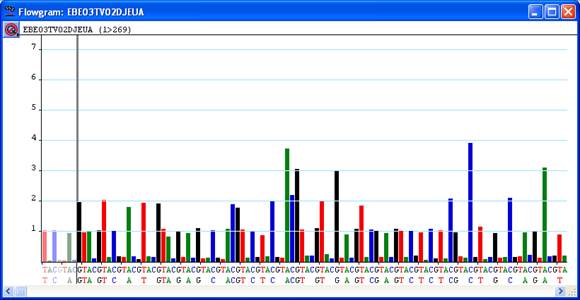
You may use the trim bars (vertical gray lines) in this view to trim the ends of the sequences prior to assembly.
Note: Some .sff files may already contain trimmed portions of sequence, representing removed adapter sequence. SeqMan Pro cannot restore these sections of data.
After assembly, you can also view flowgram data within the Alignment View. To do this, click anywhere within the sequence you wish to view, and then select Sequence > Show Original Trace/Flowgram Data.
SeqMan Pro displays flowgram data in the same orientation as the sequence lies in the contig.
•If the sequence was complemented during assembly, SeqMan Pro displays its complement.
•Any prior trimming of sequence ends causes the trimmed segments of the flowgram to appear dimmed.
•Use the Quality tool (see table below) to view the quality scores from the .sff file.
To trim data in the Flowgram view:
•Use the mouse to grab the tall gray trim bars at the ends of each sequence. When the cursor is directly over a trim bar, it will turn into a single or double sided arrow.
•To adjust trim coordinates, drag the bar horizontally. The double arrow becomes a single arrow once the sequence is fully extended.
The tools listed below are available on the left side of the Flowgram window.
The Quality buttons let you choose to display or hide the quality scores from your .sff file. Clicking the Quality icon causes two auxiliary buttons to appear in a horizontal row. Whichever button you select determines the quality score display:
|
Button Name |
Icon |
Description |
|
Quality buttons |
|
Does not display quality scores. |
|
|
Displays quality scores. The quality score (Q) from each called base within the .sff file is displayed. For bars that represent more than one base, the quality score for each consecutive base is listed in order of orientation from bottom to top. |

