 from within
the graphical view. The resulting Set Colors dialog will offer varying options
depending upon which graphical view is active. One example is shown below:
from within
the graphical view. The resulting Set Colors dialog will offer varying options
depending upon which graphical view is active. One example is shown below:All of the colors in each graphical view (Scatter Plot, Heat Map, Venn Diagrams, Line Graph, and Line Graph Thumbnails) and in the SNP Table can be customized to match
your preferences by editing the colors in the Set Colors window. This
window can be accessed by selecting Graphs > Set Colors or by clicking
the Color Settings tool  from within
the graphical view. The resulting Set Colors dialog will offer varying options
depending upon which graphical view is active. One example is shown below:

Note: See SNP Table for a description of colors used in that table.
•To edit the colors that will be used when viewing the graphical display on your computer, select Display Colors at the top of the Set Colors window. To edit the colors that will be used when printing the graphical image, select Print Colors instead. If an object in the list is applicable to just one particular mode, it is noted as such.
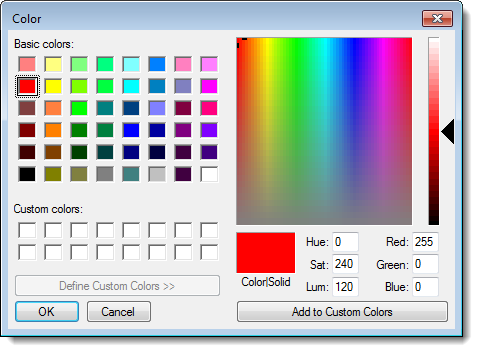
•Click on any of the objects in the list to launch a color picker from which you may select a new color.

After making changes, click Apply to apply the changes to the current view. If you wish to save these changes as your default settings, click Save as Default. To change all colors back to their original default settings, click Use DNASTAR Colors