
A numeric track displays a plot of values along one or more sequences in the project.
To display numeric tracks:
The visibility of numeric tracks in the Sequences view is dependent on:
- The origin of the project. For example, the Model ‘n’ Cα Distances track is only available for the query sequence in a project sent to MegAlign Pro using NovaFold’s Send template alignment to MegAlign Pro link. It is not available for template sequences in those projects, nor for MegAlign Pro projects that do not originate from NovaFold.
- Whether or not tracks are visible in the Sequences view. To display tracks, click on the plus sign next to the sequence of interest.
- Whether or not corresponding box is checked in the Tracks panel.
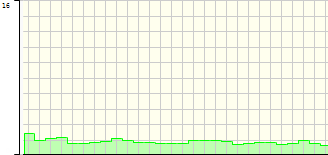
When the track is visible, it consists of a graph. For example, the Model ‘n’ Cα Distances track is a graph with a y-axis from 0-16. It shows the predicted pairwise distances between Cα atoms in a predicted model and its theoretical ideal structure. These are calculated by NovaFold using a support vector machine trained to recognize patterns in template coverage, secondary structure, solvent accessibility, and simulated structural diversity. A separate track is available for each model. Models tend to be more accurate in regions with lower distance values.
To change numeric track options:
To learn how to access the options section for this track, see Tracks.
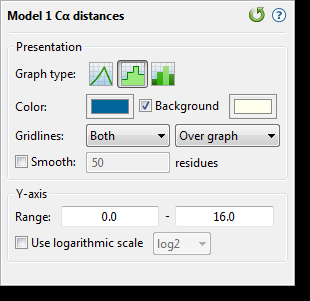
- Select from three different Graph types (Line, Skyline, Bar) by clicking on the corresponding icon.
- By default, numeric graphs are displayed in green with a pale yellow background. To choose another graph color, click on the box to the right of Color to make a selection from a color chart. To choose another background color, click the color box to the right of the Background checkbox. To turn off the background color, uncheck the checkbox.
- Use the first Gridlines dropdown menu to select which gridlines to display: Both (horizontal & vertical), Horizontal (only) or None. Use the second dropdown menu to choose whether gridlines should be visible above (Over graph) or below (Under graph) other parts of the graph.
- Check the Smooth box if you wish to average the values over a specified number of residues. Smoothing is computed by averaging values in a sliding window of the specified number of residues. Enter the number of residues in the adjacent text box (maximum=5000). Inputting a high value will smooth the graph curves, while a low value will highlight local differences.
- To change the range of values displayed, enter new y-axis endpoints in the Range text boxes. The default range may be too large or too small for some sections, causing the graph to appear empty or peaks to be cut off. You may need to raise or lower the second value, in particular, in order to see the graphical display clearly.
- Check the Use logarithmic scale box and select an option from the corresponding drop-down menu if you want to use a logarithmic, rather than a linear scale. Options are log2 or log10.
Click  if you wish to return to the default values.
Need more help with this?
Contact DNASTAR