
GeneQuest’s main view is called the Assay Document.
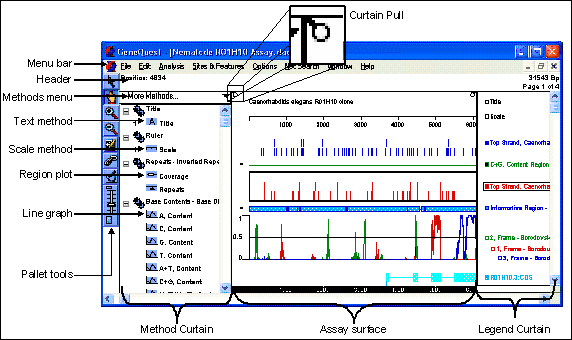
The header contains two entries at the left.

On top is the Site and Sequence display, which shows what has been selected by the range selector.
- If a single nucleotide has been selected, Position shows its location.
- If a range has been selected, Selection shows the first and last positions of the selected range and the length of the range.
- If a range spanning discontiguous segments of the same feature has been selected, Selection shows the first and last positions of each selected segment and the sum of lengths of these segments.
Underneath this is the Pointer Position Display, which shows whether the pointer is over the document, Method Curtain or Legend Curtain. When it is over the document display, the base and its sequence coordinate will appear in parentheses.
There are another two entries on the right.

The top number shows the total length of the sequence in base pairs. The bottom display shows the current page and total number of pages in the document. The page numbers may change, depending on amount of zoom, the Amplitude control setting, and the Horizontal Units setting. Be sure to check the number of pages before printing your document.
GeneQuest offers line graphs and region plots as two ways of visualizing the results of the same method.
- Line graphs (
![]() ) are composed of a series of connected points, calculated at each residue and averaged over the window you specify. The Amplitude control palette tool, Options > Plot in Peak Scale command and Options > Plot in Constant Scale command can all be used to change the amplitude of these graphs.
) are composed of a series of connected points, calculated at each residue and averaged over the window you specify. The Amplitude control palette tool, Options > Plot in Peak Scale command and Options > Plot in Constant Scale command can all be used to change the amplitude of these graphs.
 ) are composed of a series of connected points, calculated at each residue and averaged over the window you specify. The Amplitude control palette tool, Options > Plot in Peak Scale command and Options > Plot in Constant Scale command can all be used to change the amplitude of these graphs.
- Region plots (
![]() ) use the calculated data to make a yes/no decision, drawing a bar to represent a “yes” answer. The threshold for calling a region a distinct type (e.g., “high GC content”) may be adjusted when editing method parameters.
) use the calculated data to make a yes/no decision, drawing a bar to represent a “yes” answer. The threshold for calling a region a distinct type (e.g., “high GC content”) may be adjusted when editing method parameters.
 ) use the calculated data to make a yes/no decision, drawing a bar to represent a “yes” answer. The threshold for calling a region a distinct type (e.g., “high GC content”) may be adjusted when editing method parameters.
To customize the appearance of the window, see Customize the look of the Assay Document.
Comparing portions of the Assay Document:
The Assay Document has a pane divider to help you compare results from different vertical locations. This allows direct comparison without constantly scrolling up and down the document and without having to drag a method to a new location in order to juxtapose it with another method. Drag the pane divider, located near the bottom right corner of the assay document, up to activate two panes. You will now see two vertical scroll bars that you can use to position method results for comparison. To deactivate the second pane, drag the pane divider back to the bottom of the window.
Need more help with this?
Contact DNASTAR