
Coding Prediction – Borodovsky plots are used to evaluate coding potential independent of identifying ORFs. This method, located in the More Methods section, finds potential coding regions by analyzing the sequence against data contained in statistical matrix files. Combining this method with Coding Prediction – Starts Stops ORFs is particularly informative.
The method is demonstrated in the following video.
See Installed Lasergene file locations for the location of the Borodovsky matrix files after a normal Lasergene installation.
You should choose which Borodovsky matrix file to use based on the organism from which the DNA was obtained. Files are further differentiated by model order, which is the maximum mer length included in the matrix. For eukaryotes, separate matrix files are provided for sequences with different ranges of GC content.
The naming convention for Borodovsky matrix files makes it easy to choose an appropriate file. The first few characters of the file name denote the organism, the middle characters describe GC content (high, low, or a percentage) and the last digit tells the order of the mer. It is usually best to start with the largest mer size available because the method will be more selective of coding regions. If results appear as flat lines (no peaks or bars), just switch to a matrix with a smaller order and try again. For organisms with less sequence data available, you may have no choice but to use lower order matrix files.
For a list of species names that correspond to the Borodovsky matrix files, see the file Borodovsky Species Names.txt also located in the Borodovsky Matrices folder. (See above for the directory path.)
To generate a summary table of codon usage for any selected segment of the sequence, which may also be useful in identifying coding regions, choose Analysis > Codon Usage.
Results of the Borodovsky method may be displayed as line graphs and/or region plots, with separate plots for each of the six frames. The algorithm used to generate Borodovsky plots is Lukashin and Borodovsky (1998). A potential coding region will appear as a bar in a region plot or as a sharply rising, flat topped peak in a line graph. Coding regions will have a value over the threshold of 0.5, and preferably, near 1.
Tips for using the Borodovsky method:
- Before analyzing the Borodovsky graphs, it often helps to color-code each of the reading frames. For instance, you could choose red for reading frame one for both ORFs and Borodovsky plots, blue for frame 2 and green for frame 3 etc.
- It may also be helpful to superimpose the three Borodovsky plots for each strand by dragging them with the mouse or by highlighting them and selecting Options > Superimpose Objects. One layout that works well is to position the superimposed Borodovsky plots just below the corresponding ORFs plots for the same reading frames. You may then quickly establish whether any Borodovsky peak corresponds to an ORF in the same frame, as it should in genuine coding regions.
- In addition to correlating Borodovsky peaks with ORFs in the same frame, you may seek evidence for the starts of genes. The Coding Prediction – Starts Stops ORFs method allows you to pinpoint all the ATG triplets in all six frames.
- More powerfully, the Patterns – Matrix method identifies the subset of ATG triplets that are in a sequence context typical of start sites in specific organisms. For the Patterns – Matrix method, select the appropriate start site matrix pattern for your organism, and then apply region plots for the start sites for both strands.
- If you are working with a eukaryote, you might continue your evaluation of ORFs by locating candidate splice sites (see Look for exons).
To specify the default Borodovsky matrix:
- Select Edit > Preferences.
- Choose the GeneQuest tab.
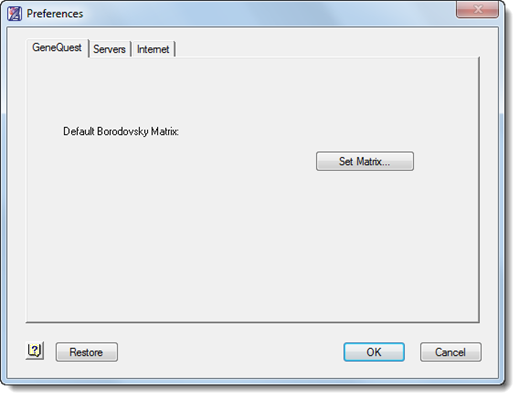
- Click the Set Matrix button and navigate to the location.
To change method parameters, including specifying the default Borodovsky matrix:
- Double click on the method name in the Method Curtain or select the method display and then Analysis > Method Parameters.
- Specify Context, the window size used in the prediction. The number you choose should be a multiple of three.
- In most cases, the default (96 bases) is sufficient.
- Smaller values produce more false positives but also increase the chance of finding small exons.
- Higher values may miss small exons but clarify the signal for coding in longer exons.
- You may restore the default window size, if desired, by pressing the Set to Defaults button.
- In most cases, the default (96 bases) is sufficient.
- Select the desired Borodovsky matrix file by clicking Set Data File. GeneQuest comes with a set of matrix files from over two dozen genomes and can use new matrices created for GeneMark. If you use a particular matrix often, you may want to set it as your default Borodovsky matrix by clicking Use as Default.
Need more help with this?
Contact DNASTAR