
The table below shows how to generate statistical tables in GeneQuest:
| Task | How To |
|---|---|
| View a summary of restriction fragments | Choose Sites & Features > Restriction Fragment Summary. To specify whether fragments in the table should be sorted by length or by location, choose Options > Fragment Summary Options. The command is enabled only if the Restriction Fragment Summary is the active window. |
| View results for relevant methods currently on the Assay Document | Choose Analysis > Tabular Data. 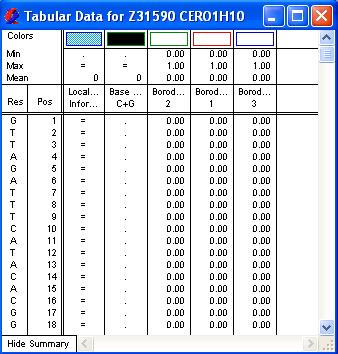 The first column shows a nucleotide, the second its position and the remaining columns show the value assigned to each nucleotide for a given analysis. Methods which calculate a numerical value (e.g., line graphs) display that value, while those making simple yes/no decisions (e.g., region plots) show a letter or symbol in positions having a value of “yes.” Pattern matches are not shown in the Tabular Data Summary, as there is not always one value per residue. To show the parameter window for the method in question, double-click anywhere on a column. Parameters may be changed by entering the new value(s) and clicking OK. GeneQuest recalculates the results. If you prefer to return to the default settings, click the Set to Defaults button in the parameter window. If you plan to print or copy part of the selection, drag the cursor horizontally across column headers or vertically across residues. To highlight non-adjacent columns, hold down the Shift key while individually selecting the names of the columns that you want. To view an expanded header at the top of each method column, click Show Summary in the lower left corner of the Tabular Data Summary. The new fields list the minimum, maximum and mean values for the plot and show the color scheme used on the assay document. To rearrange the order in which columns appear in the summary, first change the order of the graphs on the Assay Document and close, then reopen, the tabular summary. You can copy tabular data to your clipboard in the form of tab-delimited text or as an image. If you only want to copy certain columns for export, hold down the Shift key while you click each of the desired method titles. When the appropriate columns have been highlighted, select Copy. Note, however, that popular spreadsheet programs may be limited to 65,536 rows of data and would not be able to accommodate all the tabular data for sequences longer than 65,536 bases. Select File > Print Selection to print the highlighted portion of the table. |
| View the composition of nucleotides, dinucleotides, trinucleotides, tetramers, pentamers, and hexamers in the sequence | Choose Analysis > Base Composition. All nucleotide percentages are shown for mononucleotides, dinucleotides and trinucleotides, while longer strings are sorted into frequent and infrequent species. GeneQuest examines the entire nucleotide sequence unless a sub-range is selected. Method parameters for this method can be changed using Options > Base Composition Settings. To specify how many of the most frequent and least frequent mers you would like to see displayed in the table, and to learn how many hexamers are present in the sequence, choose Options > Base Composition Settings. The command is only enabled if the Base Composition summary is the active window. |
| View the distribution of codons in the nucleotide sequence, or selected nucleotide sub-range | Choose Analysis > Codon Usage. Distribution is shown for a single reading frame, beginning with the first nucleotide in the highlighted portion of the sense strand. The Codon Usage window contains a nucleotide “Base Composition” table and a “Codon Preferences” table. |
| View all repetitive portions of a sequence in a single window | After you have applied a repeat method (Repeats – Inverted, Repeats – Dyad, or Repeats – Direct), use Analysis > Repeat Summary to view all repetitive portions of a sequence in a single window. The command is disabled until at least one repeat method has been applied to the sequence. After applying a repeat method, however, the summary will remain available as long as the repeat method remains in the Method Curtain, even if it is removed from the Assay Document. The summary is divided into four areas – direct repeats, short inversions, palindromes and dyad repeats – depending upon which repeat methods have been applied to the sequence. GeneQuest shows the residues involved and the length of each repeat, as well as the starting position of the repeat in the sequence. The amount of data displayed is limited only by your computer’s memory. If your computer lacks enough memory, however, it is possible that the list of repeats may be truncated. Repeat Summary remains dimmed until at least one repeat method has been applied to the sequence. After applying a repeat method, the summary will remain available as long as the repeat method remains in the Method Curtain, even if it has been removed from the Assay Document. To designate whether repeats in this table should be sorted by length or by location, use Options > Repeat Summary Options. The command is only enabled if Repeat Summary is the active window. |
Need more help with this?
Contact DNASTAR