
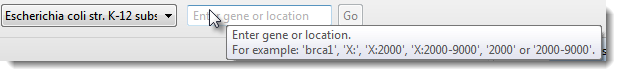
GenVision Pro’s navigation tools consist of a “sequence selector,” a text box, and a Go button. In this part of the tutorial, you will use the navigation tools to go to a particular region of low coverage that begins around 4,314,000.
- In the navigation tools area near the top of the window, hover your cursor over the sequence selector (drop-down menu) and the navigation field text box, in turn. Note that each provides tool tips.
![]()
- Enter 4314000 into the text box. (Alternatively, depending on your locale and computer settings, you could enter 4,314,000 or 4.314.000.)
![]()
Press Go or Return/Enter.

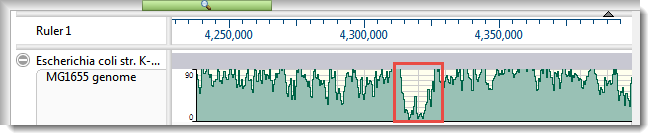
- In the Analysis View, slide the horizontal zoom slider until the Coverage track (entitled “MG1655 genome”) roughly matches the image below. Note the obvious area of low coverage (boxed in red, below).
![]()
- To optimize the Coverage track options, right-click on the name of the track and choose Show Track Options.
![]()
- Next to Graph type, click the bar graph icon (
![]() ). Note that low-coverage areas like the area found above now appear in dark green, making them easier to recognize.
). Note that low-coverage areas like the area found above now appear in dark green, making them easier to recognize.
- Experiment with other available options. For example, try changing the Height slider and/or the Y-axis Range, select a different Graph type or Color, and experiment with the Gridlines drop-down menus. Check the Use logarithmic scale button and observe how the Coverage track changes.
- When you are finished, revert to the default values using the Restore default settings tool (
![]() ).
).
- Next to Graph type, click the bar graph icon (

 ). Note that low-coverage areas like the area found above now appear in dark green, making them easier to recognize.
 ).
).Proceed to Part D: Work with region tracks.
Need more help with this?
Contact DNASTAR