
In this tutorial, you will download the protein sequence of an adhesion GPCR with cytosolic domains. These domains cannot be seen using x-ray crystallography but can be accurately predicted using NovaFold AI. The tutorial is separated into four parts for clarity, but the entire tutorial only requires about 15 minutes of “hands-on” time.
Between Parts A & B, there is 2-3 hour wait for the prediction to take place. To save time, you can elect to stop Part A just before beginning the prediction and follow Part B using a downloadable project file instead. Both options are included in the steps below.
Part A: Use NovaFold AI to predict a structure based on a linear sequence:
- Go to https://www.rcsb.org/structure/7WUQ. From the Download Files menu, choose FASTA sequence. Save to any convenient location, such as your desktop. By default, the filename is rcsb_pdb_7WUQ.fasta.
- Launch Protean 3D.
- In the Welcome screen, click Structure Prediction on the left. Then look at the middle option in the center of the screen.
- If you are already logged into NovaCloud Services, you will see New protein structure with NovaFold AI. Click this link to open the NovaFold wizard at the Sequences screen.
- If you are not logged in to NovaCloud Services, all the options in the center of the screen simply say Log in to NovaCloud Services with your DNASTAR Account. Click on any of these links to open the Services view. Enter your login credentials and press Log in. Then click the box NovaFold AI to open the NovaFold AI wizard at the Sequences screen.
- If you are already logged into NovaCloud Services, you will see New protein structure with NovaFold AI. Click this link to open the NovaFold wizard at the Sequences screen.
- In the Sequences screen, click Add File and open the FASTA file you downloaded. Note that five jobs are listed in the table, one for each chain.

For this tutorial, you will remove chains 2-5 in order to save time and prediction fees.
- Select Chains 2-5 using Shift+click, then press Remove. Only the topmost chain should remain in the dialog.

Press Next.
- In the Options screen, keep the defaults and press Next.
The Submit screen shows how many predictions you will be submitting to NovaCloud services; in this case, 1 prediction.

- If you want to use one of your NovaFold AI predictions for the tutorial and wait 2-3 hours for the results, click Submit and continue to the next step. Otherwise, close the wizard without submitting the prediction and go directly to Part B of this tutorial.
- If you submitted the prediction in the previous step, press Close when that button is enabled.
- Use the Predictions view to monitor the progress of the job. A blue triangle in the Status column shows that the prediction is in progress.
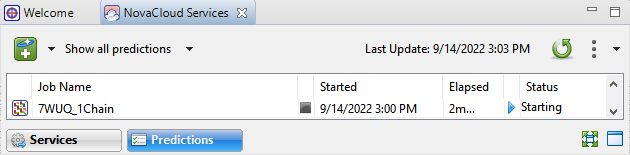
This prediction will take about 2-3 hours to complete. If you close Protean 3D and come back to check the status later, you can open the Predictions view using View > NovaCloud Services > Predictions.
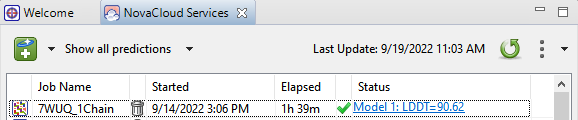
- Once the job status is complete, the Status column will display a blue link. Note that the LDDT number may vary from that in the image below, as the algorithm and its templates are continually being updated.
Part B: Exploring the predicted structure results:
- If you followed all the way to the end of Part A, click on the link to open the results in Protean 3D. If you stopped prior to submitting the prediction, instead download the tutorial data and extract the .zip archive to a suitable location such as your desktop. Double-click on 7WUQ_1Chain.novafoldai.structure to open it in Protean 3D.
Initially, all of the top five prediction models are displayed simultaneously.

- To view only the highest-ranked model, go to the Molecules section of the Explorer panel (View > Explorer > Molecules) and uncheck all boxes other than Model 1 > A.
- Open the Color section of the Style panel (View > Style > Color) and note that the default Color style for your NovaFold AI prediction is Color by temperature.
- To see a legend for the selected color scheme, use the menu to select the (already active) Color by temperature option. This opens the Choose a Gradient popup. Note that Confidence is selected. By default, NovaFold AI predictions are colored to show residue-level confidence in the prediction, using the same colors and thresholds used by EMBL-EBI in their AlphaFold 2 model database. Residues with the highest level of confidence are shown in dark blue in the Structure view, while those with the lowest level are displayed in orange.
- Click on Ranges to reveal the lower half of the popup, where you can see the legend for the Confidence color scheme.

If desired, you can experiment with specifying custom range thresholds for each color and/or check the box in this dialog to reverse the direction of the gradient.
- In the Report view (View > Report > Show), use the drop-down menu to look at each of the three reports in the menu. To view another report—this one showing biophysical properties—click the green plus-sign icon (
![]() ) and choose Biophysical Properties from Document.
) and choose Biophysical Properties from Document.
 ) and choose Biophysical Properties from Document.
Part C: Comparing the predicted structure to the version determined by x-ray crystallography:
- Choose Structure > Align Structures > Structure Alignment. The wizard bypasses the Structure screen and opens at the Selection screen. Go back to the Structure screen by clicking Structure on the left.
- Click Add PDB ID. Then type in 7WUQ to specify the x-ray crystallography structure from the PDB database.

- Press OK. Then press Next.
- In the Selection screen, the list on the right starts with all five available models that were predicted from your protein sequence using NovaFold AI. Only Model 1 will be needed for this comparison, so select Models 2-5 and press the left arrow to remove them from the list.

- When only Model 1 and 7WUQ remain in the list on the right, press Run or Run Now.
- On the right of the window, open the Explorer > Molecules section and the Style > Color area so you can see both at the same time.
- In the Molecules section, uncheck all the boxes except for Model 1 > A and 7WUQ > A.

- Now color the predicted structure green and the PDB structure purple, as follows:
- In the Molecules section, select the predicted structure by clicking on 7WUQ_1Chain. Then, in the Color section, click on Fill and choose any shade of green from the color picker.
- In the Molecules section, select the A chain of the PDB structure by clicking on Guanine nucleotide-binding protein G(s) subunit alpha isoforms short. Then, in the Color section, click on Fill and choose any shade of purple from the color picker.
- Double-click on the black background of the Structure view to clear the selection.
- Spin and examine the overlaid structures. As shown in the image below, the NovaFold AI prediction (green) includes a a cytosolic domain that is not visible in the structure that was determined by x-ray crystallography (purple). That’s because x-ray crystallography cannot resolve structural regions that are too mobile or disordered, due to deconstructive interference of their diffraction patterns. In these situations, the NovaFold AI prediction may provide information about a structure that traditional methods cannot.

This is the end of the tutorial.
Need more help with this?
Contact DNASTAR