
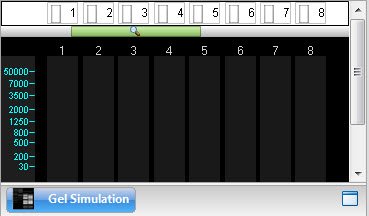
The Gel Simulation view is available in the Document window after using the File > New Agarose Gel command. By default, the view contains eight empty lanes and has a 10 cm width and 7 cm height., but these parameters can be changed as desired. The following image shows how the view appears before setting up a gel simulation. The view contains a ruler on the left, and lane numbers at the top of each empty lane and in the status bar (i.e., the header).
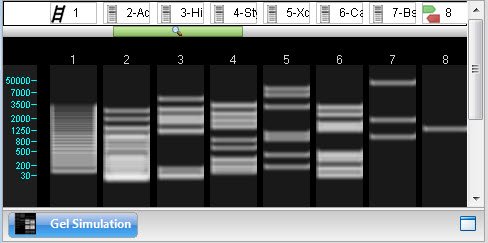
After setting up the gel simulation, the header shows the marker(s), enzyme(s) and/or primer(s) that have been applied to each lane. A ladder icon is used to represent a marker, a “gel” icon to represent an enzyme, and green/red primer arrows to represent a primer pair.
The following table shows tasks pertaining to the Gel Simulation view.
| Task | How to… |
|---|---|
| Specify the number of lanes, size of the gel, percent agarose and run time | Use the Settings panel. |
| Apply markers, enzymes, and primer pairs | See Agarose Gel Simulation. |
| Select a lane | Click on the lane number header, or click anywhere in the lane. |
| View information about what has been applied to the lane | Hover the mouse over the status bar above that lane to reveal a tooltip. |
| View information about a band or fragment size notation | Hover the mouse over it to reveal a tooltip. |
| Select a fragment and its range on the sequence | Click on a band. The fragment is shown in red, and the footer is populated with information about the selection. Any fragment from the same sequence as the selected fragment, and which overlaps the selected fragment in any way, will appear in blue. |
Need more help with this?
Contact DNASTAR