
In Part A of this tutorial, you read about how the SeqMan NGen assembly project was set up. In this part, you will download the CEPH Trio.astar assembly results file and perform downstream analysis in ArrayStar.
ArrayStar is a discovery tool that provides many different ways to analyze data. The following workflow shows just a sampling of the ways in which you could analyze the CEPH Trio data set. In this case, you will be using advanced filtering to search for potentially deleterious non-synonymous changes in the daughter, and will use the SNP Table to find the source of the SNPs.
- Download T4_Whole_Genome.zip (40 MB) and extract it to any convenient location (i.e. your desktop). The data set consists of a single file, CEPH Trio.astar.
- Double-click on CEPH Trio.astar to open it in ArrayStar.
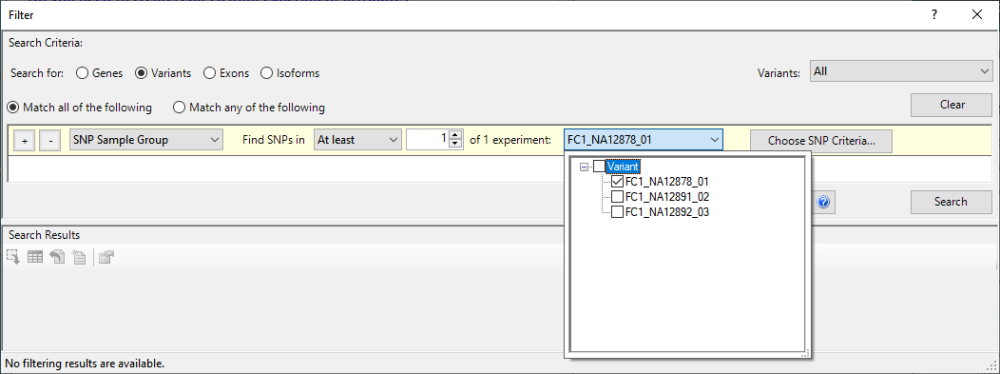
- Choose Filter > Filter All. In the gray heading, keep the default settings Search for = Variants and Variants = All. In the yellow filter row, keep the default SNP Sample Group and find SNPs in At least 1 of 1 experiments. To change the second “3” to a “1,” click the drop-down menu that begins with FC1_NA12878 and uncheck all of the boxes except for FC1_NA12878_01 (the daughter).
Deleterious changes are unlikely to occur as homozygotes in germline. To reflect this:
- Click Choose SNP Criteria.
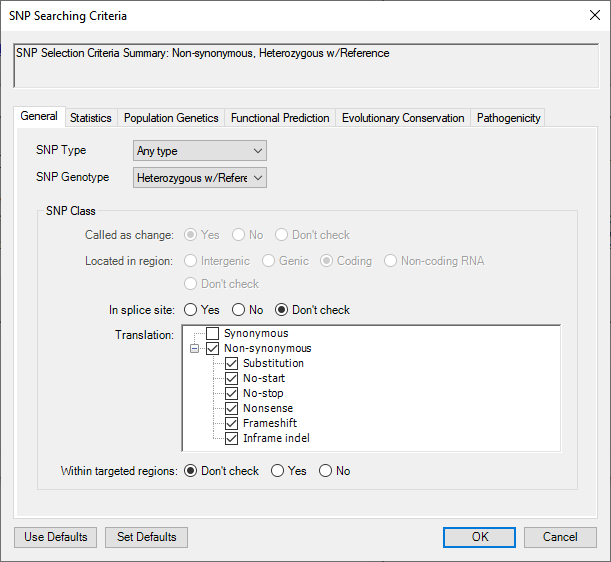
- In the starting tab (General), change SNP Genotype to Heterozygous w/Reference. In the Translation section, check Non-synonymous. This will add checkmarks to all subclasses as well.
![]()
- Select the Statistics tab. Check the box next to Filter minimum P not ref and change the number to 90.00 (90%). Check the Filter minimum depth box and change the number to 20.
![]()
Press OK.
- In the starting tab (General), change SNP Genotype to Heterozygous w/Reference. In the Translation section, check Non-synonymous. This will add checkmarks to all subclasses as well.

- Back in the Filter dialog, press Search. As shown in the bottom left corner of the dialog, 616 matching variants have been found.

To cut down the number of matches, you will next restrict matches to those variants predicted to be pathogenic in NCBI’s ClinVar database.
- Again press Choose SNP Criteria.
- Select the Pathogenicity tab. On the left, click on clinvar_clnsig. On the right, add checkmarks next to Likely pathogenic and Pathogenic. Press Add Filter to Set and then press OK.
- Back in the Filter dialog, press Search. Now, a single variant is found that matches all criteria. This variant occurs in the APOA4 gene.
![]()
- Press the Select and Show Results in Variant Table tool (
![]() ).
).
- In the ensuing SNP Table, click on the link in the dbSNP ID column to go to the corresponding web page.
![]()
- On the web page, click the ClinVar link to open a page where you can see submitted interpretations, citations and other information about the putative deleterious variant. Note that the Review Status near the top indicates that no assertion criteria have been provided that the variant is pathogenic. This result is therefore inconclusive.

 ).
). 

You will next try a different line of inquiry. You will change SNP filtering criteria to filter to those variants predicted to be deleterious rather than pathogenic.
- Once again, press Choose SNP Criteria.
- Select the Pathogenicity tab and click the Remove button to remove the ClinVar criterion.
- Select the Functional Prediction tab.
- On the left, click LRT_pred. On the right, check the box next to Deleterious (D). Click Add Filter to Set.
- On the left, choose MutationTaster_pred. On the right, check both Disease causing – automatic (A) and **Disease causing (D)*, then click Add Filter to Set.
- On the left, choose SIFT_pred. On the right, check Damaging, then click Add Filter to Set.
Deleterious mutations are likely to be rare in a given population. So in the next step, you will add criteria to filter to variants that are rare in the European population (MAF <5%).
- On the left, click LRT_pred. On the right, check the box next to Deleterious (D). Click Add Filter to Set.
- Select the Population Genetics tab. Click on the plus sign next to 1000Gp3_MAF to expand it, then choose 1000Gp3_EUR_MAF (the European group). Click Add Filter to Set.
- Click OK.
- Select the Pathogenicity tab and click the Remove button to remove the ClinVar criterion.
- Back in the Filter dialog, press Search. This search yields 4 variants.
In the final step, you will identify the parent from which each variant was inherited.
- Click the Select and Show Results in the Variant Table tool (
![]() ).
).
The SNP Table contains three columns for Called Seq. The column ending in 01 pertains to the daughter; 02 to the father; and 03 to the mother. Look at the red text in the Called Seq columns. This indicates that two of the four variants were inherited from the mother; one from the father; and one arose de novo in the daughter.
![]()
The variant in this gene… … is found in: PTK7 mother and daughter SMARCA2 daughter only POMT1 mother and daughter JMJD8 father and daughter

This marks the end of this tutorial.
Need more help with this?
Contact DNASTAR