
In Part A of this tutorial, you set up and ran a templated RNA-Seq assembly using SeqMan NGen. In this part of the tutorial, you will analyze assembly results in ArrayStar using a “quick gene set” and the Gene Table to locate a potential operon structure.
- If you ran the assembly in Part A, skip to Step 3. Otherwise, download T1_RNA-Seq (abbrev).zip (4.3 MB) and extract it to any convenient location (e.g., your computer’s desktop). The data set consists of a single file, Templated RNA-Seq.astar.
- Double-click on Templated RNA-Seq.astar to open the project in ArrayStar.
- In ArrayStar, select Graphs > Venn Diagrams from the menu, and then press the Quick gene set creation button.
- Because this project used DESeq2 normalization, Step 1 is not available. Instead, the dialog opens at Step 2 - Experiments to compare. Keep the default (all boxes checked) and press Move to Step 3 (Comparisons).
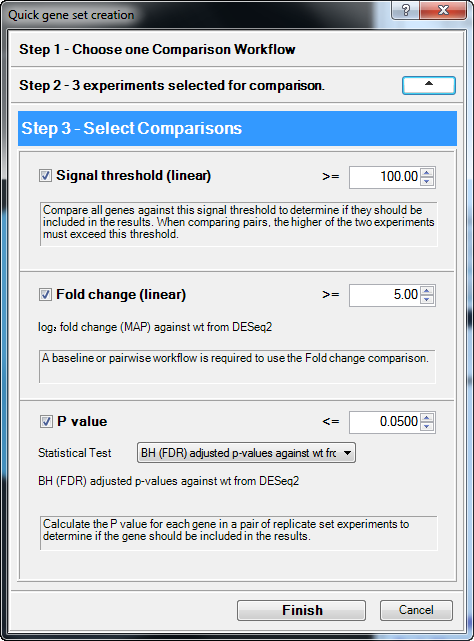
- In Step 3 – Select Comparisons, set up the filter to find genes in the mutant samples that have a ≥ 5-fold change, compared to the wild type, and an rlog signal value ≥ 100. To do this:
- Keep the Signal Threshold (linear) box checked and change the value from 10.00 to 100.00.
Note that signal calculation varies depending on which normalization method was selected in SeqMan NGen. In this tutorial, DESeq2 was used, so the Signal is in terms of rlog values. These values are transformed to the linear scale in this dialog and in ArrayStar’s Gene and Isoform tables. If normalization had instead been edgeR or RPKM, the Signal would have been in terms of the TMM or RPKM values, respectively.
- Keep the Fold change (linear) box checked and change the value from 2.00 to 5.00.
![]()
- Press Finish.
- Keep the Signal Threshold (linear) box checked and change the value from 10.00 to 100.00.
- In the upper right section of the ArrayStar window, note that two sets have been created. Click the box next to Global Gene Sets to select both sets. The Venn Diagram becomes populated with data.
The blue circle labeled “AB” denotes the intersection of the two sets, and represents genes which are up- or down-regulated for both samples: flhC and flhD.
- Click on AB to select it, and then press the link in the bottom right of the window: Remember the selection as a Gene set.
- When prompted to enter a name for the gene set, type “Up- or down-regulated in both” and press OK.

The Set List view opens, with the new set already selected.
- Click the link Select and show the table of this set’s Genes.

The Gene Table opens with 59 genes selected. Do NOT click anywhere in the table for now, as you need to retain the selection (blue highlighting).

- Click the Add/Manage Columns tool (
![]() ) to open the Manage Columns dialog:
) to open the Manage Columns dialog:
- The Gene Info button is active by default. Select Target Range, then press the > Add Column > button to add the item to the Current Columns list.
- Press the up arrow button
![]() ) repeatedly until Target Range appears just after Name.
) repeatedly until Target Range appears just after Name.
![]()
- Click OK to close the Manage Columns dialog and return to the Gene Table.
- The Gene Info button is active by default. Select Target Range, then press the > Add Column > button to add the item to the Current Columns list.
 ) to open the Manage Columns dialog:
 ) repeatedly until Target Range appears just after Name.
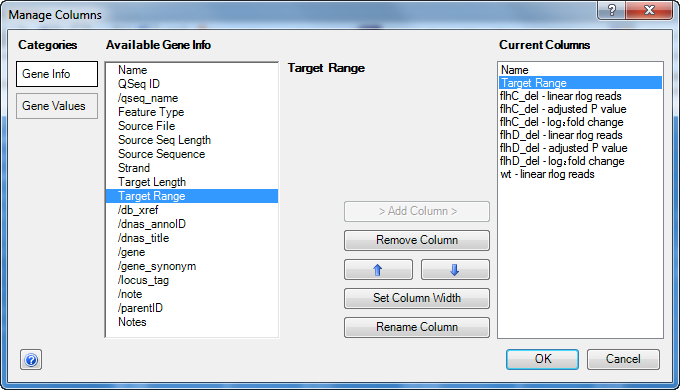
- In the Gene Table, click once on the column header for Target Range to sort all of the genes in the project in ascending order of appearance on the assembly.
- To identify possible operon structures, scroll down the Gene Table. Genes with blue highlighting represent the downregulated genes in the “quick gene set.” Large blue-highlighted sections with overlapping or consecutive genes that show similar trends in expression levels and fold changes are candidates for operons.
The first operon candidate begins at Target Range 1129830..1129414.
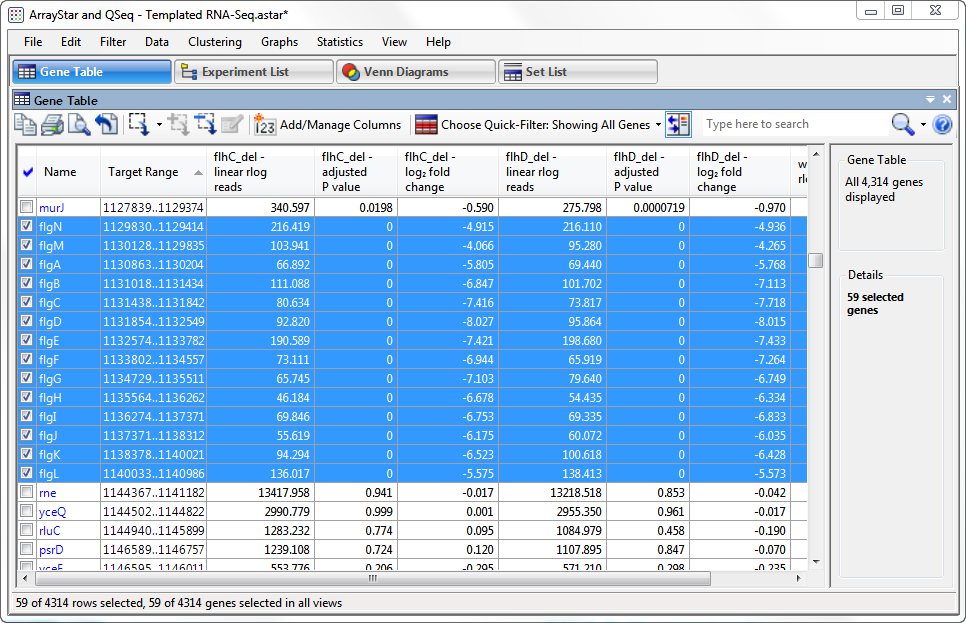
Note that the P-values for both flhC and flhD are 0 in every case, signifying extremely high confidence. Also note that the log2 fold changes for both flhC and flhD are all between approximately -4 and -8, indicating strong downward regulation for both. By comparison, less than 1.5% of the 4,300+ genes have a log2 fold change less than -2.
Other candidates for operons begin at: 1962972..1962580; 2001024..200473; and 2013014..2012700. In all cases, all P-values are zero, and log2 fold changes are similar to those in the first operon.
- To see only the genes in the ‘quick gene set,’ click on the Choose Quick-Filter tool (
![]() ) above the table, and select Show Only Gene Set. In the pop-up, select ‘Up- or down-regulated in both’* and press OK.
) above the table, and select Show Only Gene Set. In the pop-up, select ‘Up- or down-regulated in both’* and press OK.
 ) above the table, and select Show Only Gene Set. In the pop-up, select ‘Up- or down-regulated in both’* and press OK.
- Click once on the Name column header to sort alphabetically by gene name.
Observe that most of the down-regulated genes have a name prefix of ‘fli, ‘flg’ or ‘che.’ The first two gene types encode flagella-related proteins while the third type encodes chemotaxis-related proteins. These findings corroborate that these samples are missing coding genes related to flagellar and chemotaxis functions.
Proceed to Part C: Analyzing the results in ArrayStar using advanced filtering.
Need more help with this?
Contact DNASTAR