 .
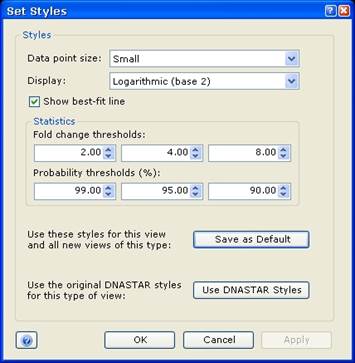
. Preferences for the
Scatter Plot view can be defined
in the Set Styles window. This window can be accessed by selecting Graphs
> Set Styles while the Scatter Plot is active, or by clicking the
Style Settings tool  .
.

Select the size of the data points displayed, and whether they will be plotted on a linear or logarithmic (log2) scale.
Turn on or off the best-fit line by checking or unchecking the box.
Edit the Fold change and Probability thresholds to change the values used to generate the links in the Statistics section of the Info Pane.
After making changes, click Apply to apply the changes to the current view. Or click Save as Default to save these changes as your new default settings. Clicking Use DNASTAR Styles changes all values in the Set Styles window back to their original default settings.