Image
Description
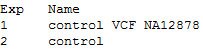
The names of the standard and the Validation Control experiments.
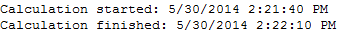
Calculation start and finish times.
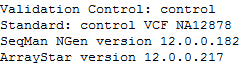
•The experiments assigned as the Validation Control and Standard.
•The version number of SeqMan NGen that was used in assembly.
•The version number of ArrayStar that was used in Validation Control calculation.
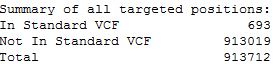
Summary of all targeted positions:
•In Standard VCF - the number of positions in the VCF file that are within the targeted regions. These will typically represent the known variant positions.
•Not in Standard VCF - the number of positions within the targeted regions that are not present in the VCF file. These will typically represent the known non-variant positions.
•Total - the total number of positions in the targeted regions. This is the sum of the two values above.
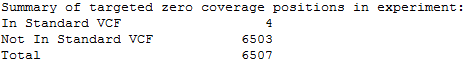
Summary of all targeted zero coverage positions in experiment:
•In Standard VCF - the number of positions in the VCF file that are within the targeted regions with no overlapping data reads in the control experiment.
•Not in Standard VCF - the number of positions within the targeted regions that are not present in the VCF file, with no overlapping data reads in the control experiment.
•Total - the total number of positions in the targeted regions with no overlapping data reads in the control experiment. This is the sum of the two values above. None of these positions are considered in the accuracy calculations.

A brief summary of results for the SNP stringency filter, which was set to “high” in this example: minimum depth of coverage = 10, PNotRef ≥ 0.90.
Note: If stringency was not specified in the project, ArrayStar uses a minimum depth of coverage = 10 and PNotRef ≥ 0.75.
In the example at left, only the 661 total positions in the targeted regions (standard SNPs) with a minimum depth of 10 are included. Of those, only the 657 positions with PNotRef ≥ 0.90 are considered “true positives.” The 4 targeted positions with a minimum depth of 10, but PNotRef < 0.90 are considered to be called reference bases (“false negatives”).
Notice that the number of standard SNPs (661) plus the number of positions with a depth of coverage below 10 (32) equals the total number of targeted positions In Standard VCF (693, two rows up).
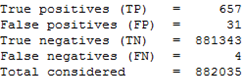
A breakdown of true/false positives/negatives. See table below for descriptions.

The calculated statistics. See table below for descriptions.