
In Part B of this tutorial, you located a putative duplication in the reference sequence using ArrayStar. Deletions or duplications can be confirmed graphically by sending them to SeqMan Pro or GenVision Pro. In this section, you will use GenVision Pro to view a graphical representation confirming the putative duplication found in the previous section.
- In the Gene Table, click on a random row to select it. Then right-click on the row and choose Send Selection to GenVision Pro. GenVision Pro launches with the display centered on the target range you selected in Part B.
- In the navigation area near the top of the GenVision Pro window, enter the range 100000-1500000 and press Go.

- Slide the Analysis View’s green horizontal slider to the left until you can see the range from approximately 100,000 to 1,500,000.

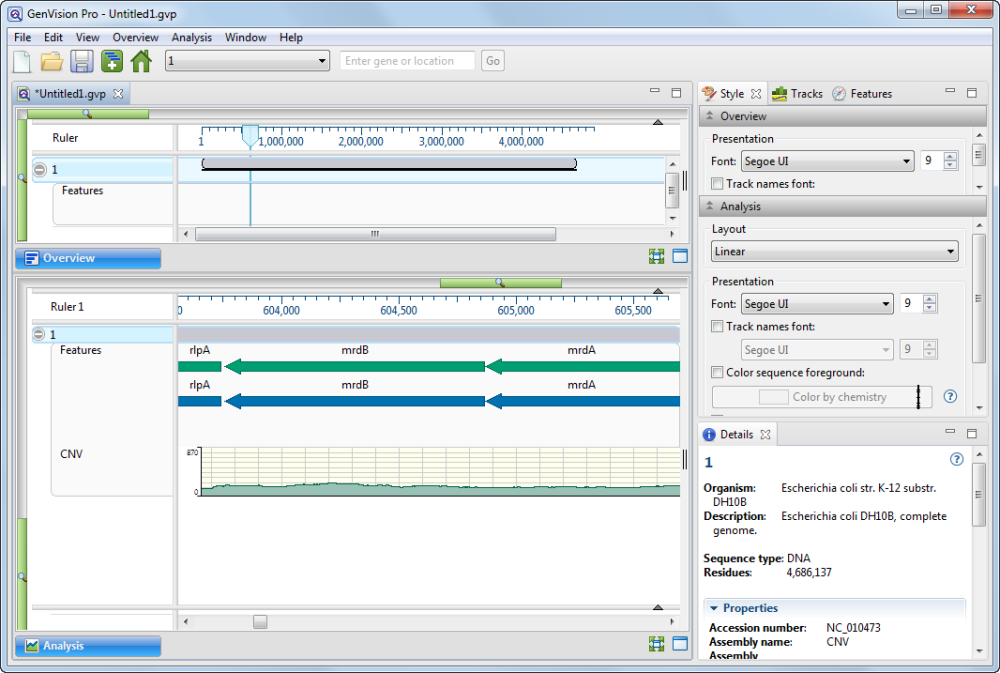
- Look at the green coverage graph (“CNV”) at the bottom of the view. Note how the coverage drops in the area from 500,000-700,000. This indicates a likely duplication in the reference sequence. The sample reads have been divided between the two copies, resulting in half the expected coverage in this range. (To the right, you can also see a deletion.)
- Zoom in on the putative duplication until it fills the entire window. Even though the features are very small at this zoom level, compare the feature sizes and relative positions. It appears there are two duplicate sets of features, side-by-side.
- Hover over “sibling” features with the mouse, one at a time, to confirm that the feature names match. This further corroborates that the region has been duplicated in the reference sequence.

This marks the end of this tutorial.
Need more help with this?
Contact DNASTAR