) Displays a pair
consistency graph. See Pair Consistency for further
information. This graph type is available for other types of projects but is
only specified by this tool in the circumstances described above.
) Displays a pair
consistency graph. See Pair Consistency for further
information. This graph type is available for other types of projects but is
only specified by this tool in the circumstances described above. For certain .assembly projects originating from SeqMan NGen, the Strategy View contains a togglable tool.
This tool appears if you performed an RNA-Seq assembly in SeqMan NGen after first checking Stranded RNA-seq reads in the Input Sequence Files screen; or if you manually edited the SeqMan NGen script and added the text stranded:true as a parameter after assemblyInfo.
The tool has two states:
•() Displays a pair
consistency graph. See Pair Consistency for further
information. This graph type is available for other types of projects but is
only specified by this tool in the circumstances described above.
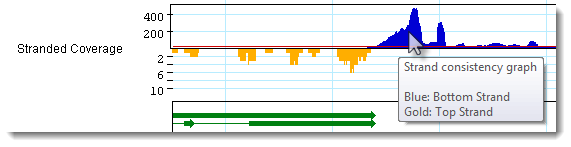
• Displays a graph
showing stranded coverage, specific to RNA-Seq assembly projects. If this tool
is selected, SeqMan Pro uses gold and blue coloring to flag genes as coming from
the top or bottom strand of the RNA-Seq reads. Hover over the graph to display a
tooltip with a color legend.
Displays a graph
showing stranded coverage, specific to RNA-Seq assembly projects. If this tool
is selected, SeqMan Pro uses gold and blue coloring to flag genes as coming from
the top or bottom strand of the RNA-Seq reads. Hover over the graph to display a
tooltip with a color legend.