Displaying the Pair Consistency Graph
The Pair Consistency graph displays a summary of either split
reads (for non-paired data) or good versus bad paired end sequence data content
(for paired reads). This graph is a standard part of the Strategy View header
for most assembly projects.
Note:
The graph is not shown automatically if you performed an RNA-Seq assembly in
SeqMan NGen after first checking Stranded RNA-seq reads in the Input
Sequence Files screen; or if you manually edited the SeqMan NGen script and added the
text stranded:true as a parameter after assemblyInfo. In this case, you need to use a togglable tool in the Strategy View to
specify that the graph be displayed.
•
 Displays a graph
showing stranded coverage, specific to RNA-Seq assembly projects. See Stranded
Coverage for details.
Displays a graph
showing stranded coverage, specific to RNA-Seq assembly projects. See Stranded
Coverage for details.
•
( ) Displays the pair
consistency graph.
) Displays the pair
consistency graph.
Once the graph is displayed, hover over it to show a tooltip
with a color legend.
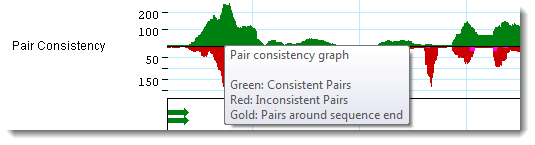
•
Green bars, located above the baseline, indicate the presence of pairs
that are consistent with the current assembly.
•
Red bars, located below the baseline, indicate the presence of pairs that
are inconsistent with the current assembly due to relative orientation, distance
apart, or both.
•
Gold bars, located below baseline, span regions corresponding to paired
reads in different contigs whose assembly locations or orientations are
inconsistent with Pair
Specifier Parameters, even if the contigs were rescaffolded or
reordered.
•
Pink bars, located below the baseline, represent split reads in the same
contig whose locations or orientation are inconsistent with Pair Specifier parameters.
A bar is added to the Pair Consistency graph for every
recognized pair of reads, so the deeper the bars, the more pairs there are. Note
that SeqMan Pro cannot distinguish whether inconsistent pairs are due to naming
errors or assembly errors.