
The Homologs view displays the results of a gene homology alignment.
To access the view, perform a gene homology alignment. Then click on the Homologs tab or choose View > Homologs > Show. Use the dropdown menu at the top left of the view to choose whether to display Shared by all homologs or Unique to reference strain.
An example of a populated Homologs view is shown below:
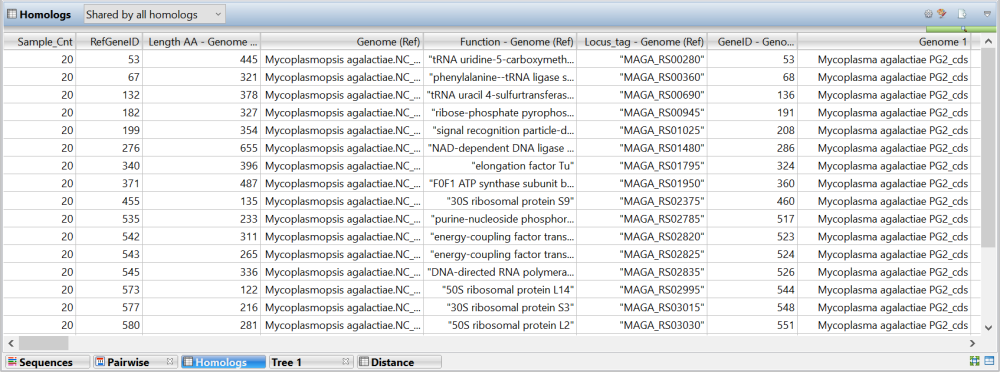
Available columns depend on which table (all homologs or “unique to reference”) is displayed. Some columns can be displayed multiple times; once for each genome and/or reference.
| Column | Description |
|---|---|
| Sample_Cnt | The total number of samples in the alignment. |
| Genome | The name of the reference or sample sequence file with the file extension removed and replaced with “_cds”. For example, if the reference sequence was named M. agalactiae.NC_013948.1.gbk, it would be displayed in this column as M. agalactiae.NC_013948.1_cds. |
| Function | The /product tag of the CDS from the reference sequence file. |
| Length AA | The length of the CDS in nucleotide base pairs (from the reference sequence file) -2, divided by 3). |
| Locus_tag | The /locus tag for the CDS from the reference sequence file. |
| RefGeneID | The order in which the CDS appears sequentially along the genome in the reference sequence file. |
| % coverage | The percentage of the length between an aligned gene and the reference gene. Available only for sample sequences. |
| % similarity | The percentage of relatedness between two aligned sequences. Available only for sample sequences |
Tasks pertaining to the Homologs view:
| Task | How To… |
|---|---|
| Choose columns that should appear in the view and their order | Press the Choose or rearrange columns ( ) tool in the top right of the view. Items in the list on the right are the columns currently being displayed and the order in which they appear. Make selections and use the up/down and right/left arrows to add, subtract, and reorganize these columns as desired. ) tool in the top right of the view. Items in the list on the right are the columns currently being displayed and the order in which they appear. Make selections and use the up/down and right/left arrows to add, subtract, and reorganize these columns as desired. |
| Change the font display | Click the Show Style tool ( ) to add a row below the current header that lets you change the look of the font in this table. ) to add a row below the current header that lets you change the look of the font in this table.  You can use the drop-down menu to select a different font, change the font size, or specify the use of bold (“B”) or italic (“I”) fonts. To minimize the row, click the tool again or use the Collapse tool (inverted ‘v’) on the right of the row. |
| Export data from the view | Click the Export Data tool ( ), a shortcut to the File > Export Data subcommands. See Export data to a file. ), a shortcut to the File > Export Data subcommands. See Export data to a file. |
Need more help with this?
Contact DNASTAR