
- Click here to download the data zip archive, then extract it to any convenient location (e.g., your desktop).
- Launch GeneQuest and choose File > New, then select and open the sequence WormProblem.seq. The GeneQuest window appears as shown below:
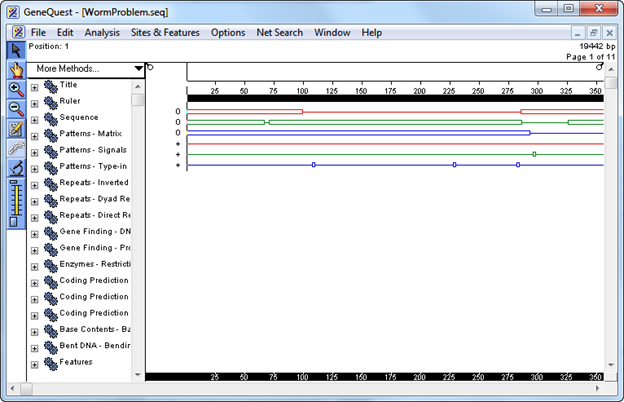
The main portion of the window is the Assay Document. It contains graphic displays of analysis methods that have already been used to analyze the sequence. The Method Curtain at left displays a list of available analysis methods.
- Select Analysis > Show Legend. The Legend Curtain is displayed to the right of the Assay Document. This curtain displays the names of the methods that have been applied to the Assay Document. At this point, only the scale, sequence, and the ORFs and Starts for the first 3 reading frames are displayed.
- In the Method Curtain to the left of the Assay Document, double-click on the method Coding Prediction-Borodovsky- volvox_0.mat so that the method parameters dialog is displayed.
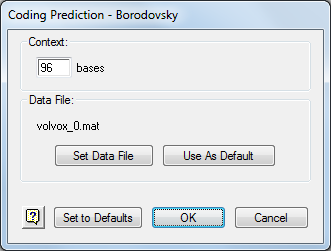
- Click Set Data File and open the Borodovsky matrix file location for your operating system. Then click Open and then OK.
- Click on the plus sign (Win) or the triangle (Mac) to the left of the method Coding Prediction – Borodovsky – ce_lo_4.mat to reveal the list of possible displays. Click the white space to the left of the displays to ungroup them.

- Use Shift+click to select Frames 1, 2 and 3.
- Drag the selected displays onto the Assay Document and drop them under the existing displays. GeneQuest calculates potential coding regions and displays them as peaks. The higher the Borodovsky peak, the higher the probability that the area is a coding region.
- Use colors to differentiate each frame of the newly applied Borodovsky displays from each other. Click the white space underneath the Borodovsky displays to ungroup them. Then click the Frame 1 Borodovsky display to select it. Choose Options > Line Color > Red. Repeat this sequence for Frame 2 and Frame 3 displays but select Green for Frame 2 and Blue for Frame 3.
- Shift+click frames 1 and 3 of the Borodovsky methods, then select Options > Superimpose Objects.
- In the Method Curtain, click on the plus sign (Win) or the triangle (Mac) to the left of the method Patterns – Matrix. Locate and select the file Matrix Patterns/celegans_ds_2.mat and click Open. This method will now be listed in the Method Curtain. Select the Top Strand of this method and drag it to the bottom of the Assay Document.
- At the top of the Method Curtain, select More Methods > Patterns > Matrix. A new entry called Patterns – Matrix will appear at the top of the Method Curtain. Add the new matrix pattern celegans_as_2.mat as in Step 11, and again drag the Top Strand to the bottom of the Assay Document.
- Repeat Step 11 for celegans_atg_2.mat.
GeneQuest calculates potential translation start, donor and acceptor sites and displays them as vertical lines. Each apparent line is really a narrow box containing a numeric score denoting the likelihood of that area being a site.
- To view the scores only, select the Zoom In tool (
![]() ) then click and drag diagonally to draw a box around the area you would like to see in more detail.
) then click and drag diagonally to draw a box around the area you would like to see in more detail.
 ) then click and drag diagonally to draw a box around the area you would like to see in more detail.
- To view the scores and other information, select the Range Selector tool (
![]() ) then click and hold on a site until an information box is displayed.
) then click and hold on a site until an information box is displayed.
- The cursor snaps to a particular point on the site. The exact base to which the cursor snaps is shown on the header at the top left of the window next to the word “Position.”
- The pop-up information box displays the bases spanned by the pattern and a candidate ranking score.
- The cursor snaps to a particular point on the site. The exact base to which the cursor snaps is shown on the header at the top left of the window next to the word “Position.”
 ) then click and hold on a site until an information box is displayed.
 - Close the method curtain by selecting Analysis > Hide Available Method.
Proceed to Part B: Predict coding regions and create features.
Need more help with this?
Contact DNASTAR