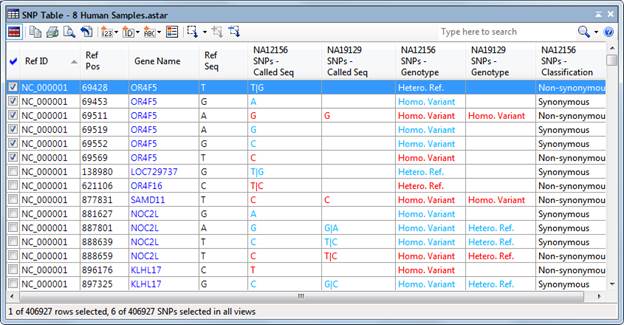
The SNP Table shows detailed information about the SNPs in your project at the SNP/small indel level. Before working with this table, you may first wish to group SNP data into appropriate categories (e.g. Disease vs. Control) in the Experiment List.
By default, all SNPs in your project are displayed each time you open a new SNP Table. The signals for Variants experiments are generated via the Set Up Preprocessing dialog. If you are viewing a SeqMan NGen assembly, by default only SNPs meeting the SNP filter stringency (High, Medium or Low) that you specified in the SeqMan NGen wizard are displayed.
For more information, see the following help topics:
•Availability of tables in different workflows
•Descriptions of columns that can be added to the tables
•How to easily view articles about the SNP on the Mastermind Genomic Search Engine
•How to add/sort/remove columns
•How to use the table tools (icons)
•How color is used in the SNP Table
Notes regarding SNP Table data:
•SNPs filtered out using the SNP filter stringency setting were not removed from the assembly and can be made visible again by changing ArrayStar’s SNP filtering parameters.
•Some columns added to this table using the Manage Columns dialog may show multiple entries for a particular position (row). These multiple entries refer to predicted effects on different isoforms of the same gene. Hover over the cell with your mouse to view a tool tip distinguishing which prediction pertains to a given isoform.
•Depending on your selections for Minimum SNP % and Minimum P not ref, there is a slight possibility of a "rounding error" occurring, in which the Gene Table may report one thing (e.g., an experiment has no Nonsense genes) whereas the SNP Table for that gene shows contradictory information (e.g., the experiment has a Nonsense gene).