
If data are available, you can choose to display a numeric track in the body of the Analysis view. As of Lasergene 17.3, the main numeric track type is the Coverage track.
For detailed information about applying tracks, see Work with Tracks. This is the Track panel item to check if you want to display a Coverage track:

Sources of data for numeric tracks:
- Numeric data of any type imported via a Wiggle file (.wig) using File > Add Track (see Add tracks).
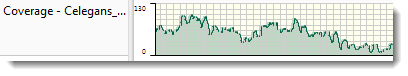
- Coverage tracks imported with a SeqMan NGen .assembly package (see Add assemblies). This track displays a plot of values along one or more sequences in the session. Values are obtained automatically from assemblies added to the session. When the Coverage track is visible, it consists of a graph showing the depth of sequence coverage for each nucleotide position along the Analysis view.
To change Coverage track options:
Coverage tracks can be customized using tools that are replicated in two locations. The first location is the Options section. To access it, select the Coverage track in the Tracks panel and then click the Options tab to expand the Options section.
Once you have checked a Coverage track in the Tracks panel, it is displayed in the Analysis view. The second location where the tools are replicated can be accessed by selecting the Coverage track in that view. A toolbar will pop up to the top-left of the track.

You can use your mouse to grab the popup on its left end and drag it to any desired location in the Analysis view. Options provided in the popup are a subset of all options available in the Options section.

- Select from three different Graph types (Line, Skyline, Bar) by clicking on the corresponding icon.
- By default, numeric graphs are displayed in green with a pale yellow background. To choose another graph color, click on the box to the right of Color to make a selection from a color chart. To choose another background color, click the color box to the right of the Background checkbox. To turn off the background color, uncheck the checkbox.
- Use the first Gridlines drop-down menu to select which grid-lines to display: Both (horizontal & vertical), Horizontal (only) or None. Use the second drop-down menu to choose whether grid-lines should be visible above (Over graph) or below (Under graph) other parts of the graph.
- Check the Smooth box if you wish to average the values over a specified number of residues. Smoothing is computed by averaging values in a sliding window of the specified number of residues. Enter the number of residues in the adjacent text box (maximum=5000). Inputting a high value will smooth the graph curves, while a low value will highlight local differences.
- Check the Logarithmic scale box if you want to use a logarithmic, rather than a linear scale. The log of 0 is not defined. Therefore, log values for the track are calculated as follows: For y > 0, y’ = log(y); otherwise, it is displayed as a 0.
- If the default display range is not be suitable for a numeric track, you may see an empty graph or a graph with the peaks cut off. To correct this, check the Maximum box and enter an integer into the associated text box. You may need to try several values before finding the ideal one.
- Click
![]() if you wish to return to the default values.
if you wish to return to the default values.
 if you wish to return to the default values.
To change the height of the graph, and the white space surrounding it, use the sliders in the Layout section.
Need more help with this?
Contact DNASTAR