
Viewing contigs and constituent sequences graphically:
In both applications, graphical information about contigs and constituent sequences is shown in the Alignment and Strategy views.
- SeqMan Pro – These views are accessed using Contig menu commands or by double-clicking on a contig in the Project Summary window.
- SeqMan Ultra – The views are accessed using View menu commands, by double-clicking on an item in the Explorer panel or by clicking the view tools to the right of the Explorer panel.
![]()
New features in SeqMan Ultra include the ability to:
- Open and compare views for two or more contigs simultaneously. For instance, you could open the Alignment view for Contig 3 and Contig 7 and compare them side-by-side.
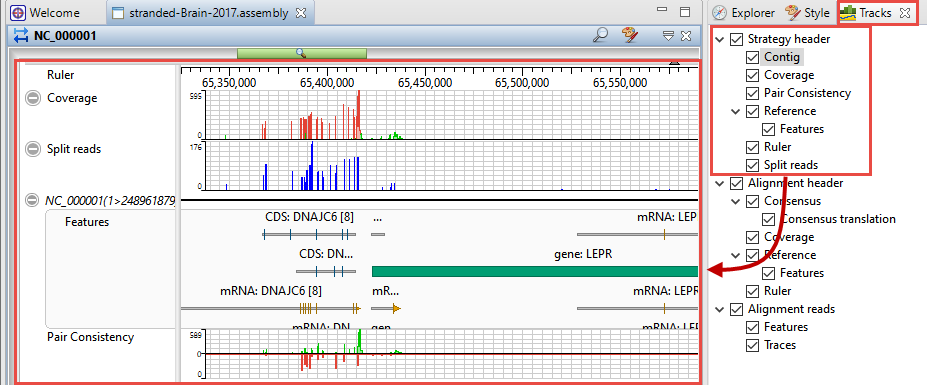
- Use the Tracks panel to specify which data tracks to generate. These can include items such as the consensus translation, consensus and read features, rulers, trace data; and coverage, split read and pair consistency graphs. Within the views, you can then choose whether to show or hide the tracks using the plus/minus sign to the left of each track. You can also reorder tracks by dragging them to the desired position and dropping them there.
![]()
- Customize track color schemes, fonts, spacing, and much more using the Style panel.
![]()
- Open and compare views for two or more contigs simultaneously. For instance, you could open the Alignment view for Contig 3 and Contig 7 and compare them side-by-side.


Need more help with this?
Contact DNASTAR