
To select which columns to display in the Structural Variation view, or to rename or reorder them, click the Choose or rearrange columns ( ) tool. The Choose Columns dialog appears.
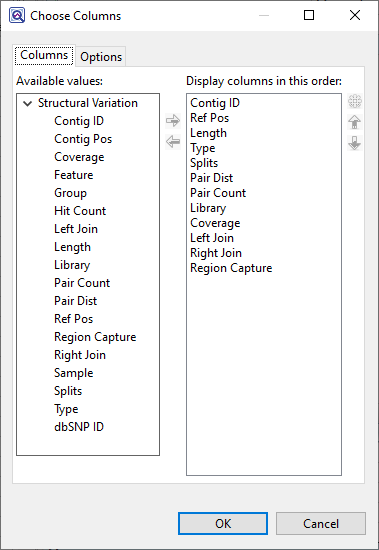
Available columns are on the left, while currently-applied columns are on the right.
- To add a column to the display, select its name on the left and press the right arrow key to move it to the right.
- To remove a column from the display, select its name on the right and press the left arrow key to move it to the left.
- To change the order of displayed columns, select the column name you wish to move on the right, then use the up/down arrows to place it in the desired order.
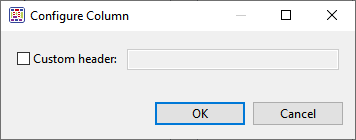
- To create a custom header for a displayed column, select its name on the right, then choose the Configure column tool (
![]() ). In the popup dialog, type in the desired name and press OK.
). In the popup dialog, type in the desired name and press OK.
Descriptions of each column appear below in alphabetical order.
| Column Name | Description |
|---|---|
| Contig ID | The name of the contig in which the SV was found. |
| Contig Pos | The position where the SV was detected in gapped coordinates. For insertions, a single coordinate is given. For deletions, the first and last coordinates of the deleted region are given. |
| Coverage | The average depth of coverage across a putative deleted or indel region. The Coverage value is the mean depth of coverage over all columns, between the two edges of the deletion, in the original (unsplit) assembly. A "good" deletion will normally have much lower coverage than the flanking regions of the assembly. In cases where the deleted region is composed of non-repetitive sequence, the Coverage value will typically be zero or near zero. In cases where the deleted region is composed of repetitive sequence (e.g. an insertion sequence [IS] element), this value will typically be some fraction of the average coverage of the entire assembly. The exact value will depend on how many instances of the repeat are in the reference and the genome being sequenced. Note that clicking a row in the Contig Structural Variation report will take you to the Analysis view column just prior to the left edge of the deletion. However, Coverage does not measure the depth of coverage of that column, as the column is excluded from the range over which the mean is taken. Coverage FAQ: Q: In the SV Report for a gap-closure workflow, why does the Coverage column display low values (e.g., 0-7) for the majority of reference positions? A: Coverage refers to the read depth in the original templated assembly and is calculated by summing the total number of aligned bases in that region and then dividing by the length of the region. Coverage is therefore expected to be low for deletions and indels. It is important to note that the Structural Variation Report is static and does not change after being created in SeqMan NGen. Q: Why doesn’t the Analysis view for an SV with a Coverage of 4 have four sequences of coverage? A: That’s because the deleted region is an insertion sequence (IS) repeat that is present elsewhere in the reference and in the data set. Since this is repeated sequence, SeqMan NGen’s assembler sees the match and places only a portion of the repeated reads in that spot. We can tell the region is deleted by the edges that form on both ends, the number of split reads defining the deletion endpoints, the relatively low depth in the deleted area and the lack of left and right joining pairs (pairs with one end outside the deletion and the other end in the putative deleted region). In cases where the deleted region is composed of unique sequence, the coverage will be zero or very near zero. |
| dbSNP ID | The dbSNP rs ID, if available, for positions with known variants. Double-clicking on the entry opens the corresponding page at dbSNP. |
| Feature | The feature(s) affected by the SV. For deletions affecting multiple features, the first and last feature are displayed separated by an ellipsis (e.g. polB…ilvH). To see a complete list of affected genes for a given SV, select the SV and use the Features > Show Feature Table command. Note that the Contig Structural Variation report does not explicitly show features of type "DNA_SPLIT,” as this feature type merely denotes the presence a structural variation. |
| Group | Specifies whether the variant was called from the NGS or the Sanger data. The NGS group is named using the Read technology selected in the SeqMan NGen wizard. If you are investigating a putative variant that was identified in the initial run of the NGS data, you can find that position here and open it in the Analysis view to check whether there is a Sanger-called variant at the same position. |
| Hit Count | Number of reads used to calculate the Structural Variation. |
| Left Join | (DNASTAR internal use only) |
| Length | Total length of the structural variation in bases. |
| Library | A number corresponding to the library with information in that row. This column is present only for assemblies with multiple mate pair libraries of different insert sizes. General information on each library can be seen on a per contig basis using the Contig > Contig Info command. |
| Pair Count | The number of mate pairs spanning the SV. For assemblies with multiple mate pair libraries of different insert sizes, a separate row for each library with spanning pairs is shown for each SV. |
| Pair Dist | The median distance between mate pair reads spanning the SV. For deletions, this distance is approximately the average distance between all pairs in the assembly plus the size of the deleted segment. For insertions smaller than the insert size of the mate pair library, this distance is approximately the average distance between all pairs in the assembly minus the size of the inserted segment. For insertions larger than the insert size of the mate pair library, no distance is reported because no pairs will span the insertion. For assemblies with multiple mate pair libraries of different insert sizes, a separate row for each library with spanning pairs is shown for each SV. |
| Ref Pos | the position where the SV was detected in ungapped reference coordinates. |
| Region Capture | Whether or not the identified region overlaps a segment in the region capture file (i.e., the BED file). |
| Right Join | (DNASTAR internal use only) |
| Sample | The sample name. |
| Splits | The number of “split reads” defining the breakpoints of a deletion. |
| Type | The type of SV: Ins (insertion), Del (deletion), or Indel (substitution). |
Need more help with this?
Contact DNASTAR