
The Enrichment Report displays exome and gene panel data and is one of several reports available in the Reports views. This report is only available for exome or gene panel assemblies that utilized BED files during the assembly process.
To display this report, select a row in the Experiments section of the Explorer panel and click the Show Reports (![]() ) tool or use the View > Reports command. Then use the drop-down menu near the top left of the table to choose Enrichment. The report may take several minutes to populate.
) tool or use the View > Reports command. Then use the drop-down menu near the top left of the table to choose Enrichment. The report may take several minutes to populate.
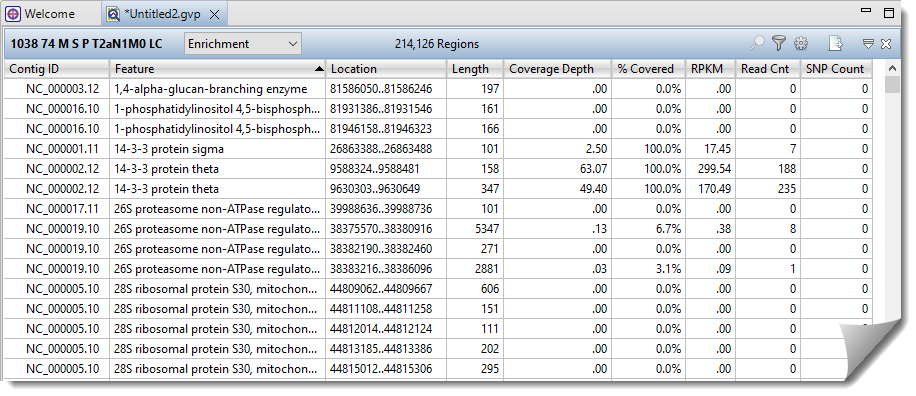
The header displays the number of targeted regions (214,126 regions in the example above). The table can be customized to display a variety of data columns in any desired order (see second table, below, for a complete list).
The following table shows ways to customize the table or export table data.
| Task | How to |
|---|---|
| Jump to a specific region in the Analysis view | Double-click on any row in the table. To see the regions displayed as data tracks in the Analysis view, see Region tracks. |
| Filter to locate regions with insufficient coverage | Press the Filter ( ) tool in the top right of the view. The filter area opens at the top left of the view. ) tool in the top right of the view. The filter area opens at the top left of the view. 
|
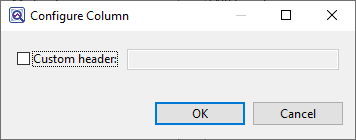
| Add, rearrange, rename, or remove table columns | Press the Change options in this view tool ( ) in the top right of the view. To select which columns to display in this table, or to rename or reorder the columns, click the Choose or rearrange columns () tool. The Choose Columns dialog appears. ) in the top right of the view. To select which columns to display in this table, or to rename or reorder the columns, click the Choose or rearrange columns () tool. The Choose Columns dialog appears.  Available columns are on the left, while currently-applied columns are on the right.
|
| Export data from the table | Press the Export data tool ( ) in the top right of the view. This opens a save dialog in which you can save the tabular data in comma-separated (.csv) or tab-separated (.tab) format. See Export data to a file for details. ) in the top right of the view. This opens a save dialog in which you can save the tabular data in comma-separated (.csv) or tab-separated (.tab) format. See Export data to a file for details. |
Descriptions of available columns appear in alphabetical order below:
| Column Name | Description |
|---|---|
| % Covered | The percent of the targeted region covered by aligned sequences. |
| Contig ID | The name of the contig in which the exome was found. |
| Coverage Depth | The average depth of coverage across the targeted region. |
| Feature | The feature corresponding to the targeted region. |
| Length | Total length of the exome in bases. |
| Location | The range of sequence associated with the targeted region, including gaps. |
| MID | Displays exons separately for each MID sample. |
| RPKM | The RPKM value averaged over the set of replicate samples. Only available if replicates and replicate sets were specified in SeqMan NGen. |
| Read Cnt | The number of reads in the exome. |
| SNP Count | The number of variants in the exome. |
| Title | The <title> field of the exon. |
Need more help with this?
Contact DNASTAR