
To view statistics from DESeq2 or edgeR in ArrayStar, you first need to create one or more SeqMan NGen assembles in which one of these statistical packages was specified as the normalization method. That specification also triggers the use of the package for differential expression analysis.
- In SeqMan NGen:
- Choose a reference-guided RNA-Seq workflow.
- In the Analysis Options screen, specify that DESeq2 or edgeR be used as the Normalization method.
- Run the assembly.
- If you performed the assembly on a Windows machine and will be doing the ArrayStar analysis on the same machine, click the Compare variants / differential gene expression between samples button in the Assembly Summary screen. Then skip ahead to Step 3. Otherwise, continue to Step 2.
- Choose a reference-guided RNA-Seq workflow.
- If you did not press the Compare variants / differential gene expression between samples button in SeqMan NGen, you can use an alternative method to open the assembly in ArrayStar:
- Launch ArrayStar and begin an RNA-Seq project.
![]()
- Use ArrayStar’s Project Setup wizard to import one or more .assembly packages created in Step 1, above.
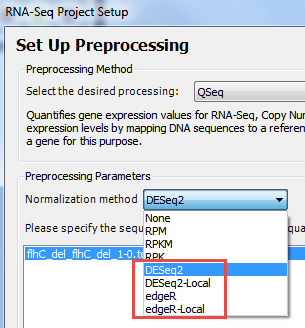
- In the Set Up Preprocessing page, choose DESeq2, or DESeq2-Local, edgeR, or edgeR-Local.
![]()
The Genomics Cloud-based options (without “-Local”) are suitable for most users. Windows users who have already installed R, Bioconductor and DESeq2 can elect to run locally by selecting the version ending in -Local.
- Launch ArrayStar and begin an RNA-Seq project.

- Access DESeq2 or edgeR statistics in ArrayStar using either of these methods:
- Open the Gene or Isoform tables and use the Add/Manage Columns tool to add DESeq2-related columns from the Gene Values or Isoform Values tabs.
- Use Filter > Filter All to open the Advanced Filtering dialog. In the header, elect to search for Genes or Isoforms. Set up one or more filter rows. In each row, use the left-most drop-down menu to select Signal Sample Group, and use the middle section of each row to set up a comparison of interest. Finally, click the Choose Signal Criteria button in each row and choose the desired settings.
For example, in the first row you might search for reads with a log2 fold change greater than or equal to 1.
![]()
In the second row, you could search for items with an adjusted P-value less than 0.05.
![]()
Use the Search button and then select all the filtered isoforms. Click on the Remember Results as an Isoform Set tool, choose a name and press OK. In the Set List, click the link Show the table of Genes containing this set’s Isoforms. In the Gene table, use the Add Fold Change tool to add the Fold Change column.
- Open the Gene or Isoform tables and use the Add/Manage Columns tool to add DESeq2-related columns from the Gene Values or Isoform Values tabs.


- (optional) To view or copy a Bioconductor script/log which you can use for QC/QA purposes or include in publications, open the Experiment List, select an experiment, and use the Show log links in the Info Pane on the right.
Need more help with this?
Contact DNASTAR