Lasergene Molecular Biology
Every molecular biologist needs reliable sequence analysis software for everyday tasks such as editing and aligning sequences and designing workable primers and clones. And while these tasks may be routine, their success impacts everything else downstream. That’s why it’s so important to have dependable, easy-to-use tools that get it right, every time.
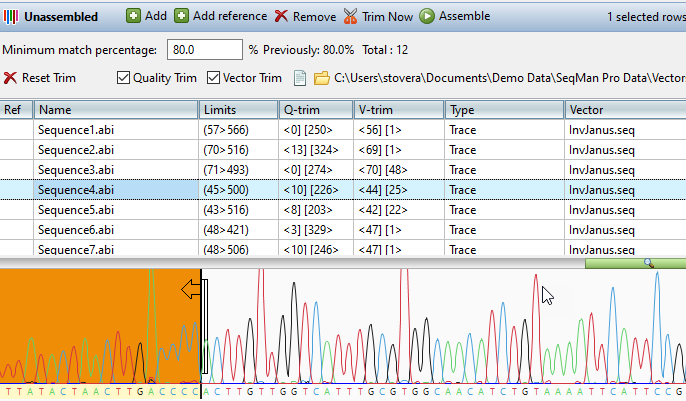
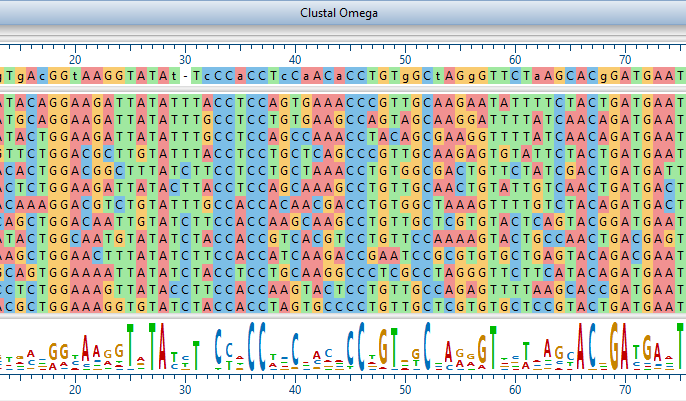
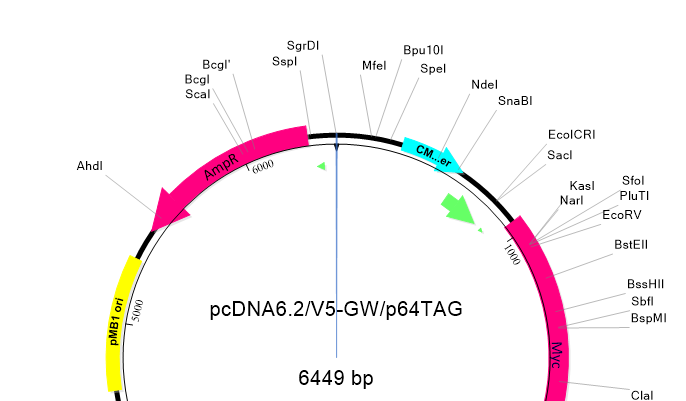
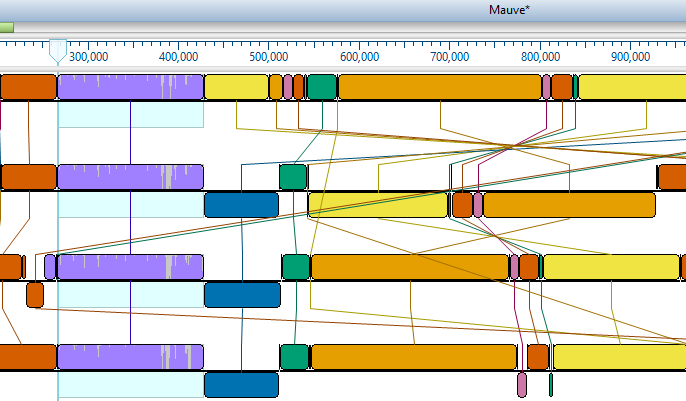
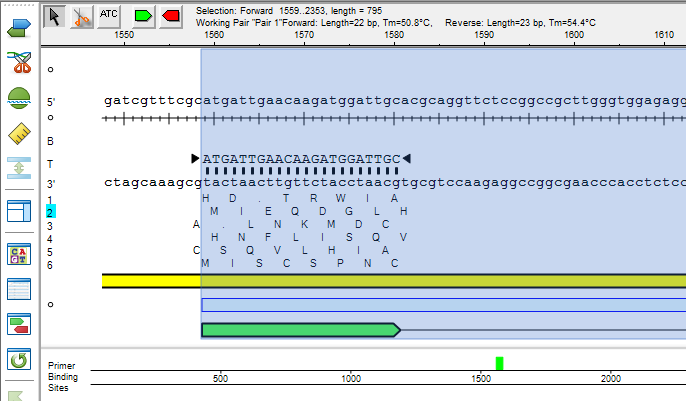
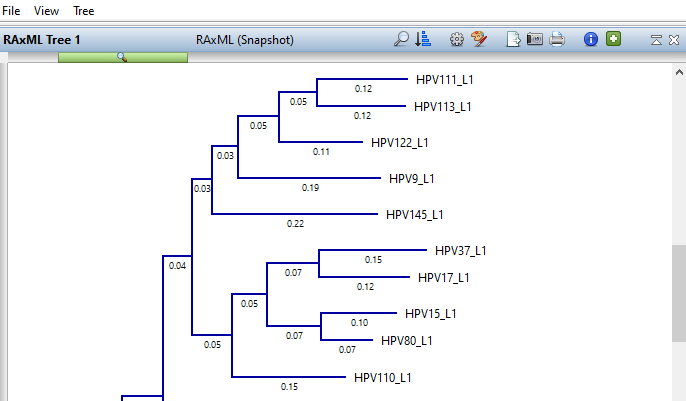
Lasergene Molecular Biology has you covered for important sequence analysis tasks including multiple sequence alignments, PCR primer design, in silico cloning, and Sanger sequence assembly. Streamline your work with features like batch editing, automated sequence annotation, access to a meticulously annotated plasmid plasmid vector map catalog, and full integration with NCBI databases. SeqBuilder Pro also integrates with the SciNote electronic lab notebook (ELN), helping improve collaboration, traceability, and research documentation. Lasergene Molecular Biology goes beyond the basics, delivering dependable sequence analysis software you can rely on every day.