
In Part A, you assembled transcriptome data in SeqMan NGen, which automatically annotated the transcripts during assembly. In this part of the tutorial, you will view the transcripts that were assembled and annotated using SeqMan NGen .
When you clicked the blue button in SeqMan NGen, the results opened automatically in SeqMan Ultra’s Transcriptome view. The Identified Transcripts table is shown initially, and will contain over 1300 entries.

Now use the drop-down menu in the view header to choose Novel Transcripts. You should see >40 Total Novel Transcripts. This table lists the assembled contigs that did not have any match to the Transcript Annotation Database that met the search criteria thresholds and therefore, were not labeled with any match information.

From within either Transcriptome view table, experiment with the following:
- Both Transcriptome tables are customizable and can display a wide variety of sortable columns To show/hide columns or change their order, click the Choose or rearrange columns tool (
![]() ) in the view header. Use the up/down/left/right arrows to choose which columns to display and their order. Descriptions of each column type can be seen in the table at the bottom of this SeqMan Ultra User Guide topic
) in the view header. Use the up/down/left/right arrows to choose which columns to display and their order. Descriptions of each column type can be seen in the table at the bottom of this SeqMan Ultra User Guide topic
![]()
 ) in the view header. Use the up/down/left/right arrows to choose which columns to display and their order. Descriptions of each column type can be seen in the table at the bottom of
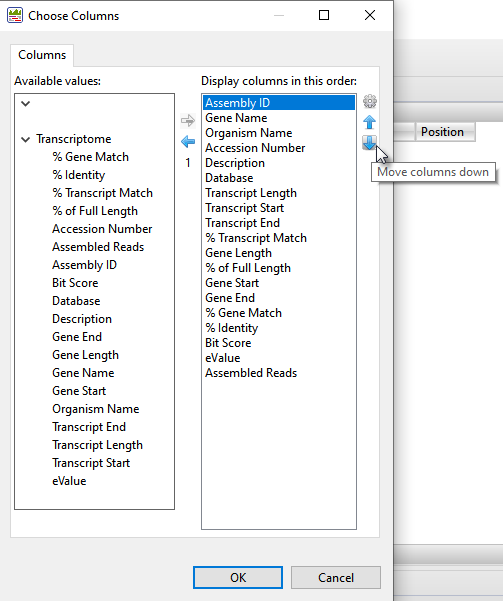
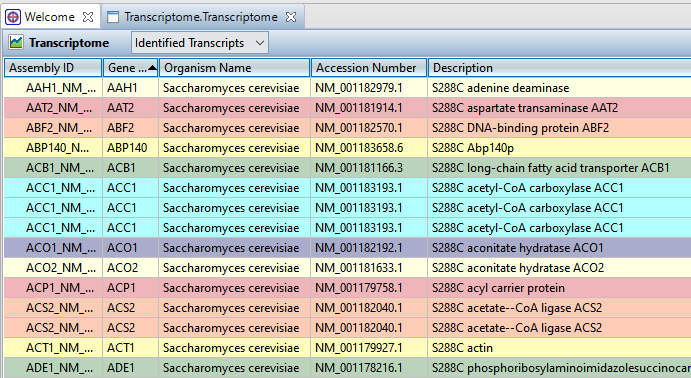
- To sort data in alphanumeric order, click on the header of the column you want to sort. Note that the resulting groups are also shown in different colors to help visually differentiate between them.
![]()
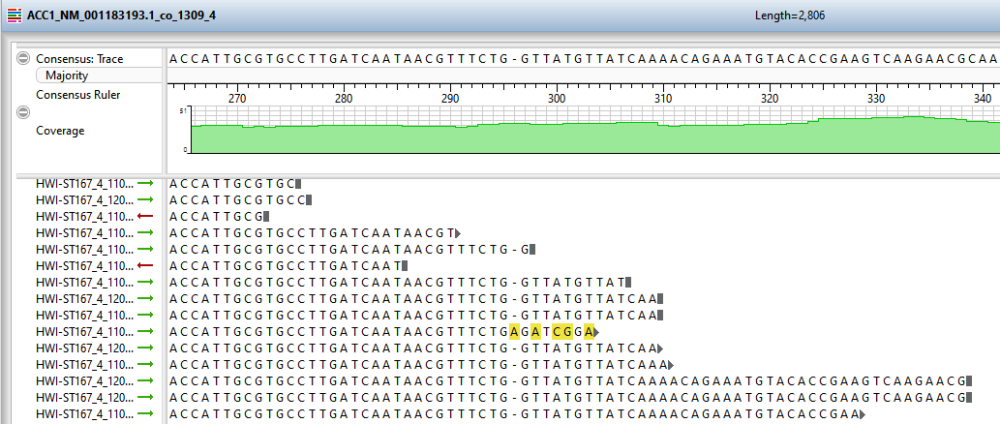
- To open an individual contig in SeqMan Ultra for visualization and editing, double-click on a row of interest to navigate to the corresponding contig assembly. The appropriate .sqd file is loaded with the Alignment view of the selected contig displayed. All the usual visualization and editing tools in SeqMan Ultra are available.
![]()
This marks the end of this tutorial.
Need more help with this?
Contact DNASTAR