
In this tutorial, you will de novo assemble fourteen short trace sequences from PE Applied Biosystems, Inc. and then analyze the resulting contig in SeqMan Ultra. Scroll to the bottom of this topic for a short video showing a slightly different version of this tutorial using the same data set.
Assembling Sanger trace reads:
- Download T4_Sanger_DeNovo.zip (1 MB) and extract it to any convenient location (i.e., your desktop). The data set consists of a folder of Janus vectors and fourteen .abi sample sequences.
- Launch SeqMan Ultra. On the left of the window, choose the blue bar named New Assembly.
- Under Molecular biology, click on New Sanger/ABI assembly. The “Unassembled” window opens.
- Press the Add button near the top left (
![]() ), select the 14 .abi sequences and press Open.
), select the 14 .abi sequences and press Open.
 ), select the 14 .abi sequences and press Open.
- In the header area, leave Quality Trim checked. This tells SeqMan Ultra to trim read ends based on trace quality evaluation. To remove Janus vector, add a checkmark next to Vector Trim and click on the file path just to its right. Navigate to and select the folder Janus vectors then press Select Folder.
- Press the Trim Now button (
![]() ). In the Vector column in the table, observe that the vector InvJanus was discovered and removed.
). In the Vector column in the table, observe that the vector InvJanus was discovered and removed.
 ). In the Vector column in the table, observe that the vector InvJanus was discovered and removed.
- Press the Assemble button (
![]() ) to begin the assembly. The assembly should take a few seconds, at the most.
) to begin the assembly. The assembly should take a few seconds, at the most.
 ) to begin the assembly. The assembly should take a few seconds, at the most.
Examining the alignment:
- In the Explorer tab on the right, note that the assembly resulted in one contig.
- Double-click on Contig 1 to open it in the Alignment view. Move the green horizontal zoom slider (near the top of the view) to the left until you can see the entire contig.
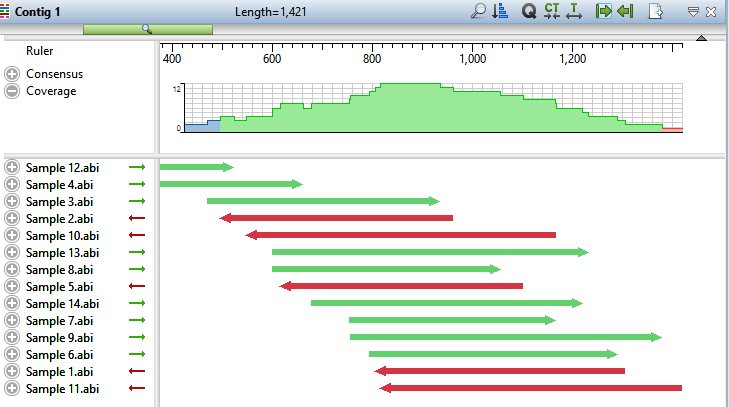
The Coverage graph has areas of blue, green and red. Blue indicates single-direction coverage, while red shows single-read coverage. Green denotes coverage on both strands; the height of the histogram corresponds to the depth of coverage.
- Hover the mouse over different parts of this histogram to see tooltips showing the coverage at a given position and whether or not it meets threshold requirements.

- To zoom in to view details, click the Restore default zoom tool (
![]() ) at the top right of the view.
) at the top right of the view.
 ) at the top right of the view.
- To locate conflicts, shown by default with yellow highlighting, click the Search alignment tool (
![]() ). Use the Find menu to choose Conflict, then press the green arrow keys to navigate from one conflict to the next.
). Use the Find menu to choose Conflict, then press the green arrow keys to navigate from one conflict to the next.
 ). Use the Find menu to choose Conflict, then press the green arrow keys to navigate from one conflict to the next.
- To view the trace data, right-click on any sample name on the left and choose Expand All.
- Scroll all the way to the right so that only Sample 12.abi is visible.
During assembly, SeqMan NGen trimmed ends for the constituent sequences based on trace data quality and presence of vector. Although sufficient data remained to assemble the sequences into a single contig, there are cases when restoring some of the trimmed data may allow SeqMan Ultra to join multiple contigs into a single contig. You may also wish to restore data in order to verify the consensus in a low-coverage area.
To reveal the trimmed trace data, grab the black triangle to the left of the sequence and drag it to the left. Trimmed sequence appears with a yellow background by default. Conflicts between the restored data and the consensus are shown via red text.

- To unmask the trimmed regions at both ends of the contig, use Contig > Extend Trimmed Ends > Extend 3’ and 5’ Sequence Ends.
- Trimmed portions of notably poor quality (e.g., misshapen and overlapping peaks) were removed because the average peak quality fell below the acceptable stringency threshold.
- Data removed due to vector contamination is characterized by normal peak quality in combination with a high number of conflicts. In this example, such regions were removed because they originated from the Janus vector. Regardless of its deceptively high peak quality, it is not recommended that you restore vector data.
- Trimmed portions of notably poor quality (e.g., misshapen and overlapping peaks) were removed because the average peak quality fell below the acceptable stringency threshold.
If you thought the trimmed ends merited being kept in the alignment (they don’t in this case), you could have used the command Contig > Extend Trimmed Ends > Extend and Align 3’ and 5’ Sequence Ends to both extend the ends and reassemble the reads.
The following video illustrates the tutorial workflow using the same data set but slightly different steps.
This marks the end of this tutorial.
Need more help with this?
Contact DNASTAR