
When Sanger/ABI trace data are used in an assembly, SeqMan Ultra analyzes the shape and intensity of peaks to calculate quality scores (Q), and averaged quality scores (Q/n). In quality score calculations:
- Taller, sharper peaks receive higher scores than less distinct peaks. The heights of any underlying peaks are subtracted from the highest peak’s score during the calculation.
- The further a peak is from the location at which the base was called, the lower the quality score.
The trace data for a DNA sequence comprises four sets of traces—one each for A, C, G, and T. Each trace contains a sequence of intensity values that can be plotted to form a graphical display of trace data. The portions of the four traces associated with a single base call each contain about ten to twelve data points. Only the trace from which the base call is derived is used to calculate a quality score (e.g. if the base call is a T, only the T trace is analyzed to calculate a quality score). The figure below shows data plotted for five base calls. The data points associated with the center base—a T—are marked with black dots.

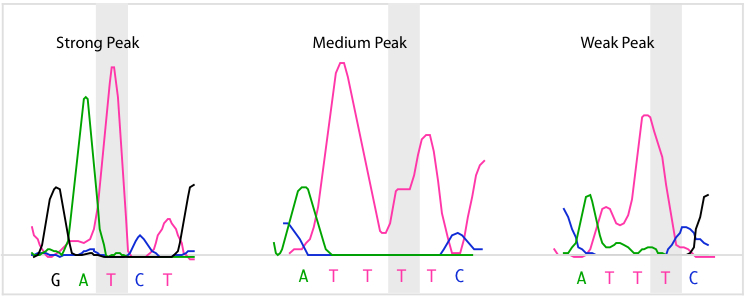
SeqMan Ultra calculates each of the peaks in the trace data. A peak is defined as trace data that exhibits negative curvature. Slope is used to differentiate between three kinds of peaks: strong, medium, and weak. Strong peaks exhibit a change in the sign of the slope, medium peaks contain a shoulder with a slope of zero, and weak peaks have neither a change in sign nor a shoulder. If the trace data for a base call do not contain a peak, its quality score is zero. The figure below contains examples of the three kinds of peaks for the highlighted T base.
Quality score calculations take into account several parameters:
- Three extreme intensity points: 5Min (5’ minimum), 3Min (3’ minimum), and Max. 5Min and 3Min are the intensity values to either side of the base call that are the minimum values of the data for that base. If a run of identical base calls occurs, then the minimums are taken from either side of the homopolymeric run. Max is the intensity value of the peak.
![]()
![]()
![]()
![]()


- Each quality score calculation includes division by the maximum intensity of all four traces for an entire sequence. This assigns higher scores to higher peaks. In this example, an A peak has the highest intensity value. Its intensity value, MaxTrace, is used in the quality score calculation for all bases in the sequence.
![]()

- Trace data files identify the point in the trace data where the base was called, or “distance weight.” In high quality data, this usually coincides with the point where SeqMan Ultra detects a peak. In poorer quality data, the peak can be offset significantly. Each quality score is adjusted to reflect the distance from the detected peak to the point where the base was called.
![]()
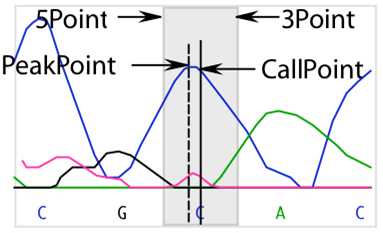
The fraction of the number of points in the offset to the total number of points is the Dist weight used in the quality score calculation. It is calculated as follows:

Need more help with this?
Contact DNASTAR