
The Distance view shows a matrix (i.e., table) of numbers representing distances computed for each pair of sequences for the selected aligned block. Sequence distances are used as input in creating the phylogenetic tree shown in the Tree view. Selections within the Distance view are synchronized with other views in MegAlign Pro. Similarly, selections made elsewhere will be highlighted simultaneously in the Distance view.
The Distance view is only accessible after you have performed a multiple alignment, and becomes inaccessible again if you unalign the sequences. After performing an alignment, you can access the view by clicking on the Distance tab or by choosing View > Distance > Show.
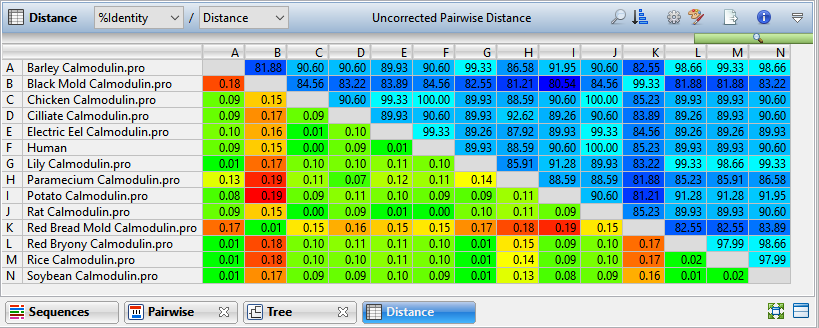
The upper-right and lower-left triangular-shaped sections of the matrix can show different information depending on Values selections made in the Distance section of the Style panel or using the drop-down menus in the upper left of the Distance view itself. For instance, in the image above, %Identity appears in the upper-right and Distance in the lower-left. Note that no numbers appear on the diagonal, since a sequence cannot differ from itself. In certain situations, it may not be possible to calculate distances for every pair of aligned sequences, in which case “NA” is displayed. In other cases, “NA” may be an artifact of the computational algorithm; for example, an attempt to calculate the log of a negative number.
If Identity is displayed, note that larger numbers correspond to greater differences between sequences. Uncorrected distances are always ≤1.0. However, the Kimura and Tamura-Nei values can exceed 1.0 because they reflect the inferred actual number of nucleotide substitutions or amino acid replacements per site, not the observed distance. When the divergence between a pair of sequence is greater than about 0.75, it may not be possible to calculate a value for corrected distance using the Kimura and Tamura-Nei metrics.
Information bar:
The blue/gray bar at the top of the view starts on the left end showing the color of the Block (multi-block Mauve alignments only). The rest of the information bar consists of information pertaining to the current selection.
| Selection | Example | Information displayed |
|---|---|---|
| Nothing |  |
The distance metric currently specified. |
| One sequence or a row/column header (letter) |  |
The name of the sequence and length in bp. |
| One table cell |  |
The number of sequences involved in the cell and their alignment status. |
Tasks pertaining to the Distance view:
| Task | How To |
|---|---|
| Customize the look and layout of the Distance view | See Customize the look and layout. Statistical metrics and fonts are set using the Distance section of the Style panel. |
| Display a tooltip with the name of the sequence corresponding to a cell | Hover over any row/column header or any cell. For projects using Pairwise gap removal (see Gap treatment options), the tool tip also contains the number of residues considered for that pair.  |
| Select all cells in the table | Choose Distance > Table > Select All. |
| Use editing commands with the Distance table | Choose Distance > Table > Copy (Select All, Rename, Rename with Fields). |
| Freeze scrolling | Choose Distance > Table > Freeze Scrolling Region. In a large table, this command allows you to compare rows near the top with those further down. |
| Search for a sequence by name | Click the Search tool ( ) on the right of the header area to open a search area. See Search for a sequence using a text query for details. ) on the right of the header area to open a search area. See Search for a sequence using a text query for details. |
| Change the order of sequences in this view | Use the Sort sequences tool ( ). See Change the order of sequences. ). See Change the order of sequences. |
| Change the parameters used to generate the distance table | Click the Change Analysis Parameters tool (  ) or choose use Distance > Parameters to open the Analysis Options dialog. See Distance metric options and Gap treatment options for detailed information on this dialog. ) or choose use Distance > Parameters to open the Analysis Options dialog. See Distance metric options and Gap treatment options for detailed information on this dialog. |
| Expand the header to show style tools | Click the Show Style tool ( ) to add a row below the current header that allows you to control the same settings that can also be controlled via the Distance section of the Style panel. ) to add a row below the current header that allows you to control the same settings that can also be controlled via the Distance section of the Style panel.  To minimize the row, click the tool again or use the Collapse tool (inverted ‘v’) on the right of the row. |
| Export data from the view | Click the Export Data tool ( ), a shortcut to the File > Export Data subcommands. See Export data to a file. ), a shortcut to the File > Export Data subcommands. See Export data to a file. |
| Save an image of the view | Click the Export Image tool ( ), a shortcut to the File > Export Image subcommands. See Export an image of the view. ), a shortcut to the File > Export Image subcommands. See Export an image of the view. |
| See additional details in the view header | To add a second row of header information, click the Show Quick Details tool ( ). ). 
|
Need more help with this?
Contact DNASTAR