

Harnessing AI-Based Protein Structure Prediction with Lasergene Protein
DOWNLOAD THIS GUIDE
Streamlining AI Structure Prediction with Lasergene Protein
Set up and run a Boltz prediction
For this example, we’ll run a Boltz prediction using the protein sequence for PDB entry 1LYZ as our query. 1LYZ is a 129-amino-acid enzyme from chicken egg white. Using a sequence with a known structure will allow us to statistically evaluate the accuracy of the Boltz prediction later in this chapter.
Step 1: Add the protein sequence
A. Launch Protean 3D and choose Modeling > Structure Prediction > Boltz to launch the Input screen.
This screen prompts you to add one or more protein sequences. Depending on the selected algorithm, these may represent a single protein, multiple interacting proteins, or more complex biological assemblies. If you are predicting a multimeric structure, note that all sequences must be included in a single file. If you are modeling a homomultimer, the file will contain multiple entries of the same sequence (e.g., three copies of the same sequence if modeling a homotrimer).
B. Click Add File and add the sequence (Figure 1), which happens to be in FASTA format. Many other formats are supported.
Other options would have been to use Enter to type in or paste in a sequence, or Batch to set up multiple predictions simultaneously.
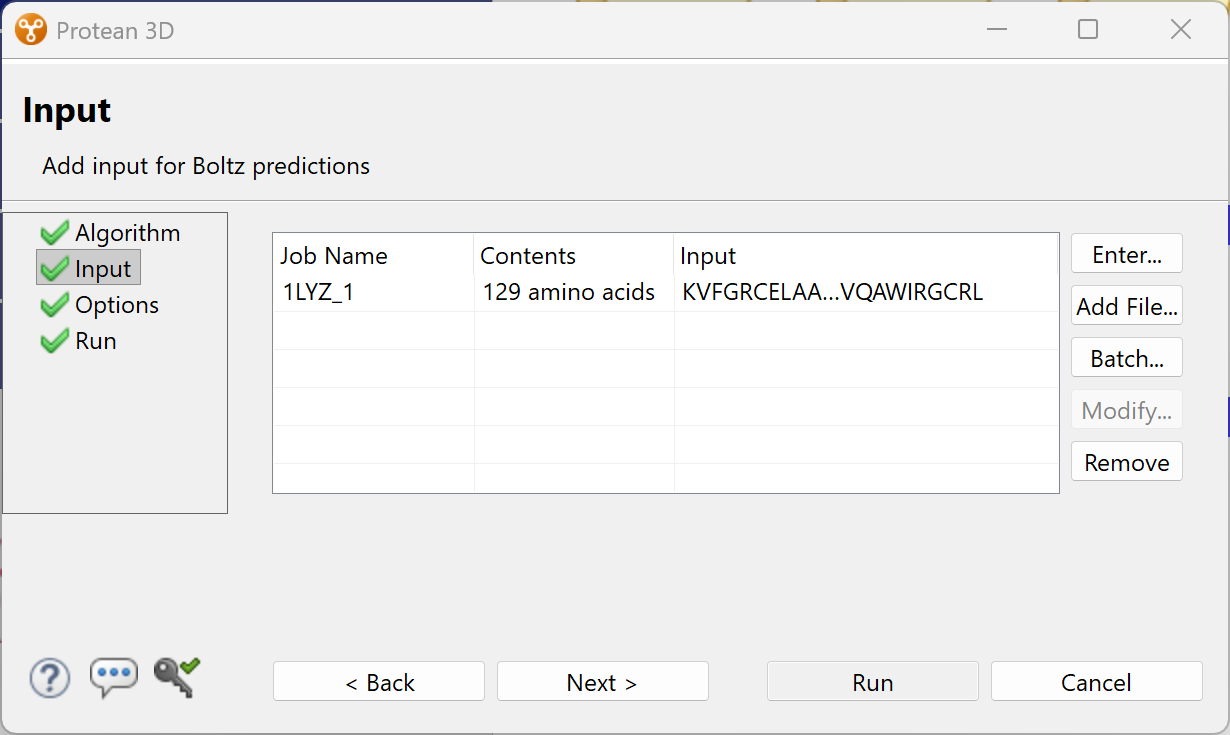
Figure 1. The Input screen after using the Add File button to add the sequence file.
C. Click Next to proceed to the Options screen. If you didn’t want to customize options, you could instead have clicked Run to begin the prediction immediately.
Step 2: Customize prediction options and submit the job
In the Options screen (Figure 2), you can review prediction settings and change them if desired.
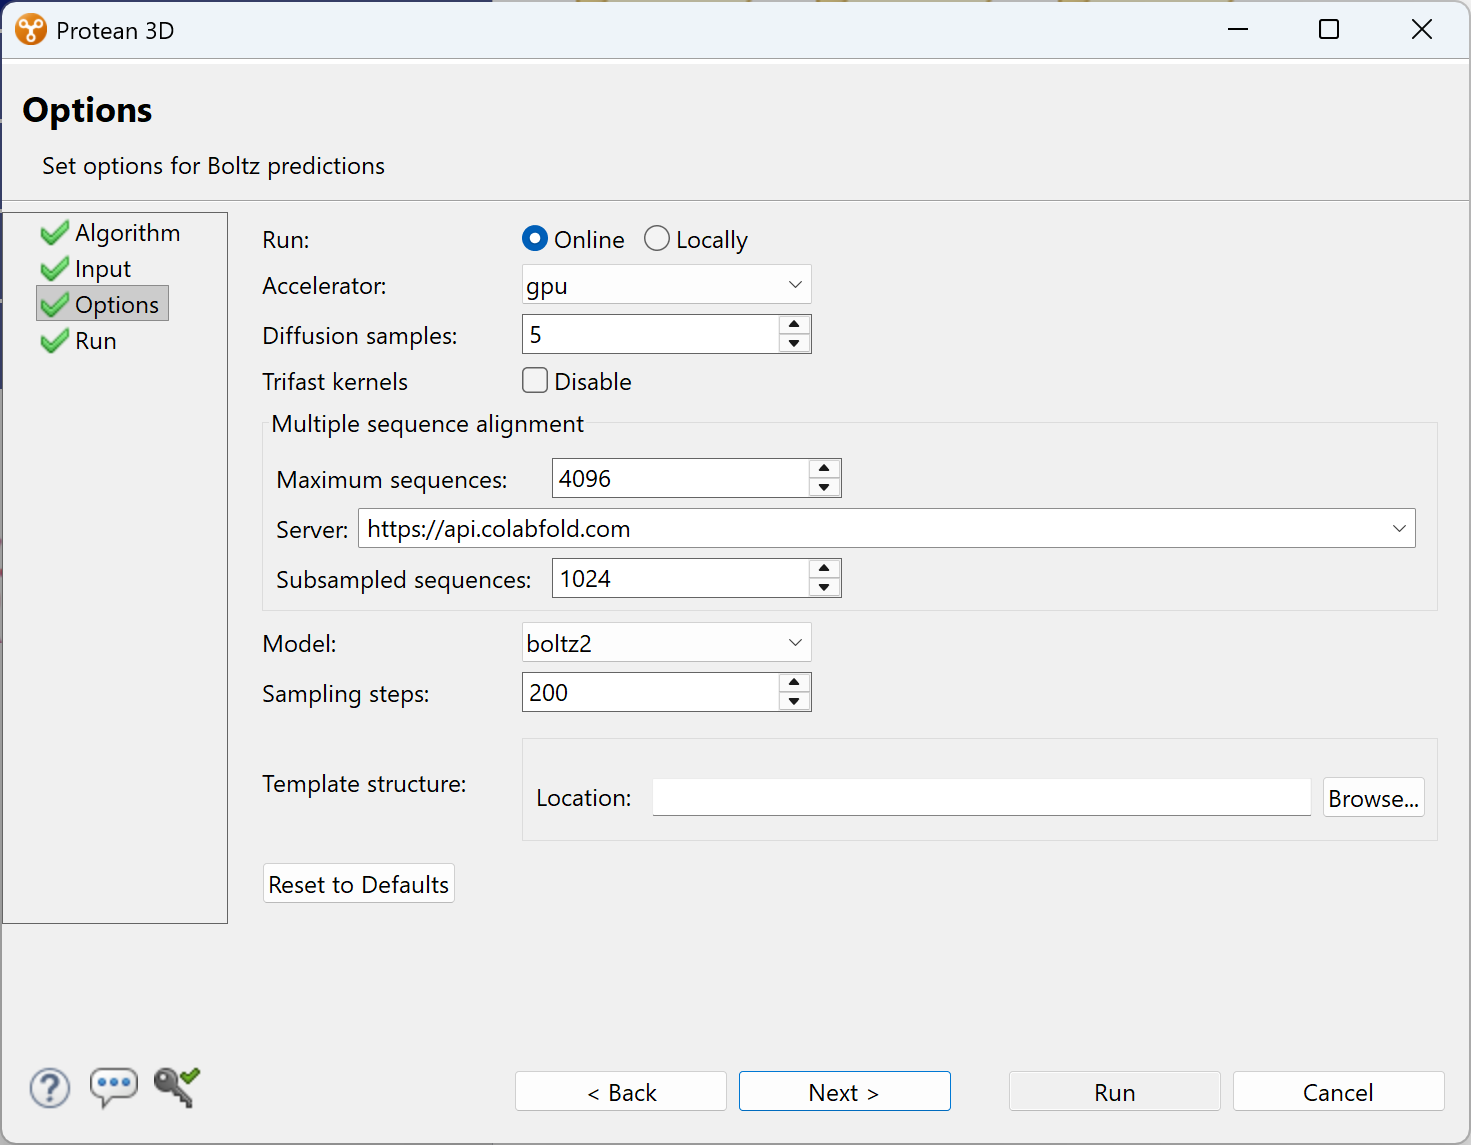
Figure 2. The Options screen showing the default settings for Boltz predictions.
The uppermost option lets you choose whether to perform calculations Online or Locally. See the next page for pros and cons of each of these options.
For this example, we will leave all options at their default settings and click Run to begin the prediction. Protein structure predictions can range from a few minutes to several hours depending on the selected algorithm, sequence length, number of sequences in a batch prediction, and complexity of the biological system.
Perform calculations locally or in the cloud
Some laboratories prefer the convenience of cloud computing, while others require predictions to remain entirely within their own infrastructure. Lasergene Protein supports both approaches. Whether predictions run in the cloud or on local hardware, the user experience remains identical.
- NovaCloud provides a fully managed cloud-based prediction environment. After submitting a prediction from Protean 3D, the computational work is performed on dedicated GPU hardware in a secure cloud environment. Your local computer remains available for other tasks while the prediction runs in the background. Because the required databases, AI models, and computational resources are maintained by DNASTAR, researchers can begin running predictions without installing specialized Linux software or maintaining large reference databases. NovaCloud is well suited for laboratories that want immediate access to AI structure prediction with minimal IT involvement. In addition to a Lasergene Protein license, NovaCloud predictions require separate prediction tokens, which can be purchased and replenished as needed.
- NovaLocal brings the same Protean 3D workflow to a locally managed computing environment. Predictions are submitted from the familiar Protean 3D interface but execute on dedicated GPU hardware within your organization’s infrastructure. This approach allows laboratories to maintain complete control over computational resources while benefiting from the same streamlined prediction setup and analysis workflow. When you use NovaLocal, there is no cap on the number of predictions you can perform, and no need to purchase prediction tokens.
Note that Boltz requires access to an MMseqs2 aligner. MMseqs2 is a fast, open-source sequence search and alignment tool used to search large reference databases and generate the multiple sequence alignments (MSAs) required for structure prediction. Most MMseqs2 aligners are online, and some are more secure than others. When running Boltz through NovaLocal, you can use the secure DNASTAR-hosted MMseqs2 server or set up your own locally-hosted MMseqs2 server for a fully offline experience.
Step 3. Monitor run progress and open the results
Monitor the progress of the run using the Jobs panel (Figure 3) in the bottom right corner of the Protean 3D window. Once the job is finished, click its link to open the resulting structure in Protean 3D.
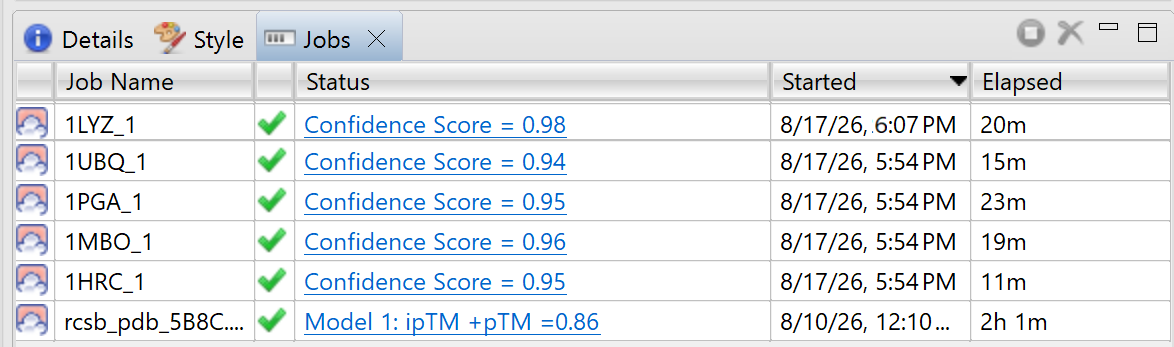
Figure 3. The Jobs panel view shows present and past predictions in list format. Click on any finished prediction to open it in Protean 3D.
Unlike many open-source prediction workflows that require separate software for structural analysis, Protean 3D is there from the prediction setup all the way through visualization and analysis of the results.
Analyze prediction results
After clicking the link for the finished job, Protean 3D displays the highest-ranked prediction model by default (Figure 4). Any combination of the five best models can be displayed and overlaid by checking and unchecking the boxes in the Explorer pane on the right.
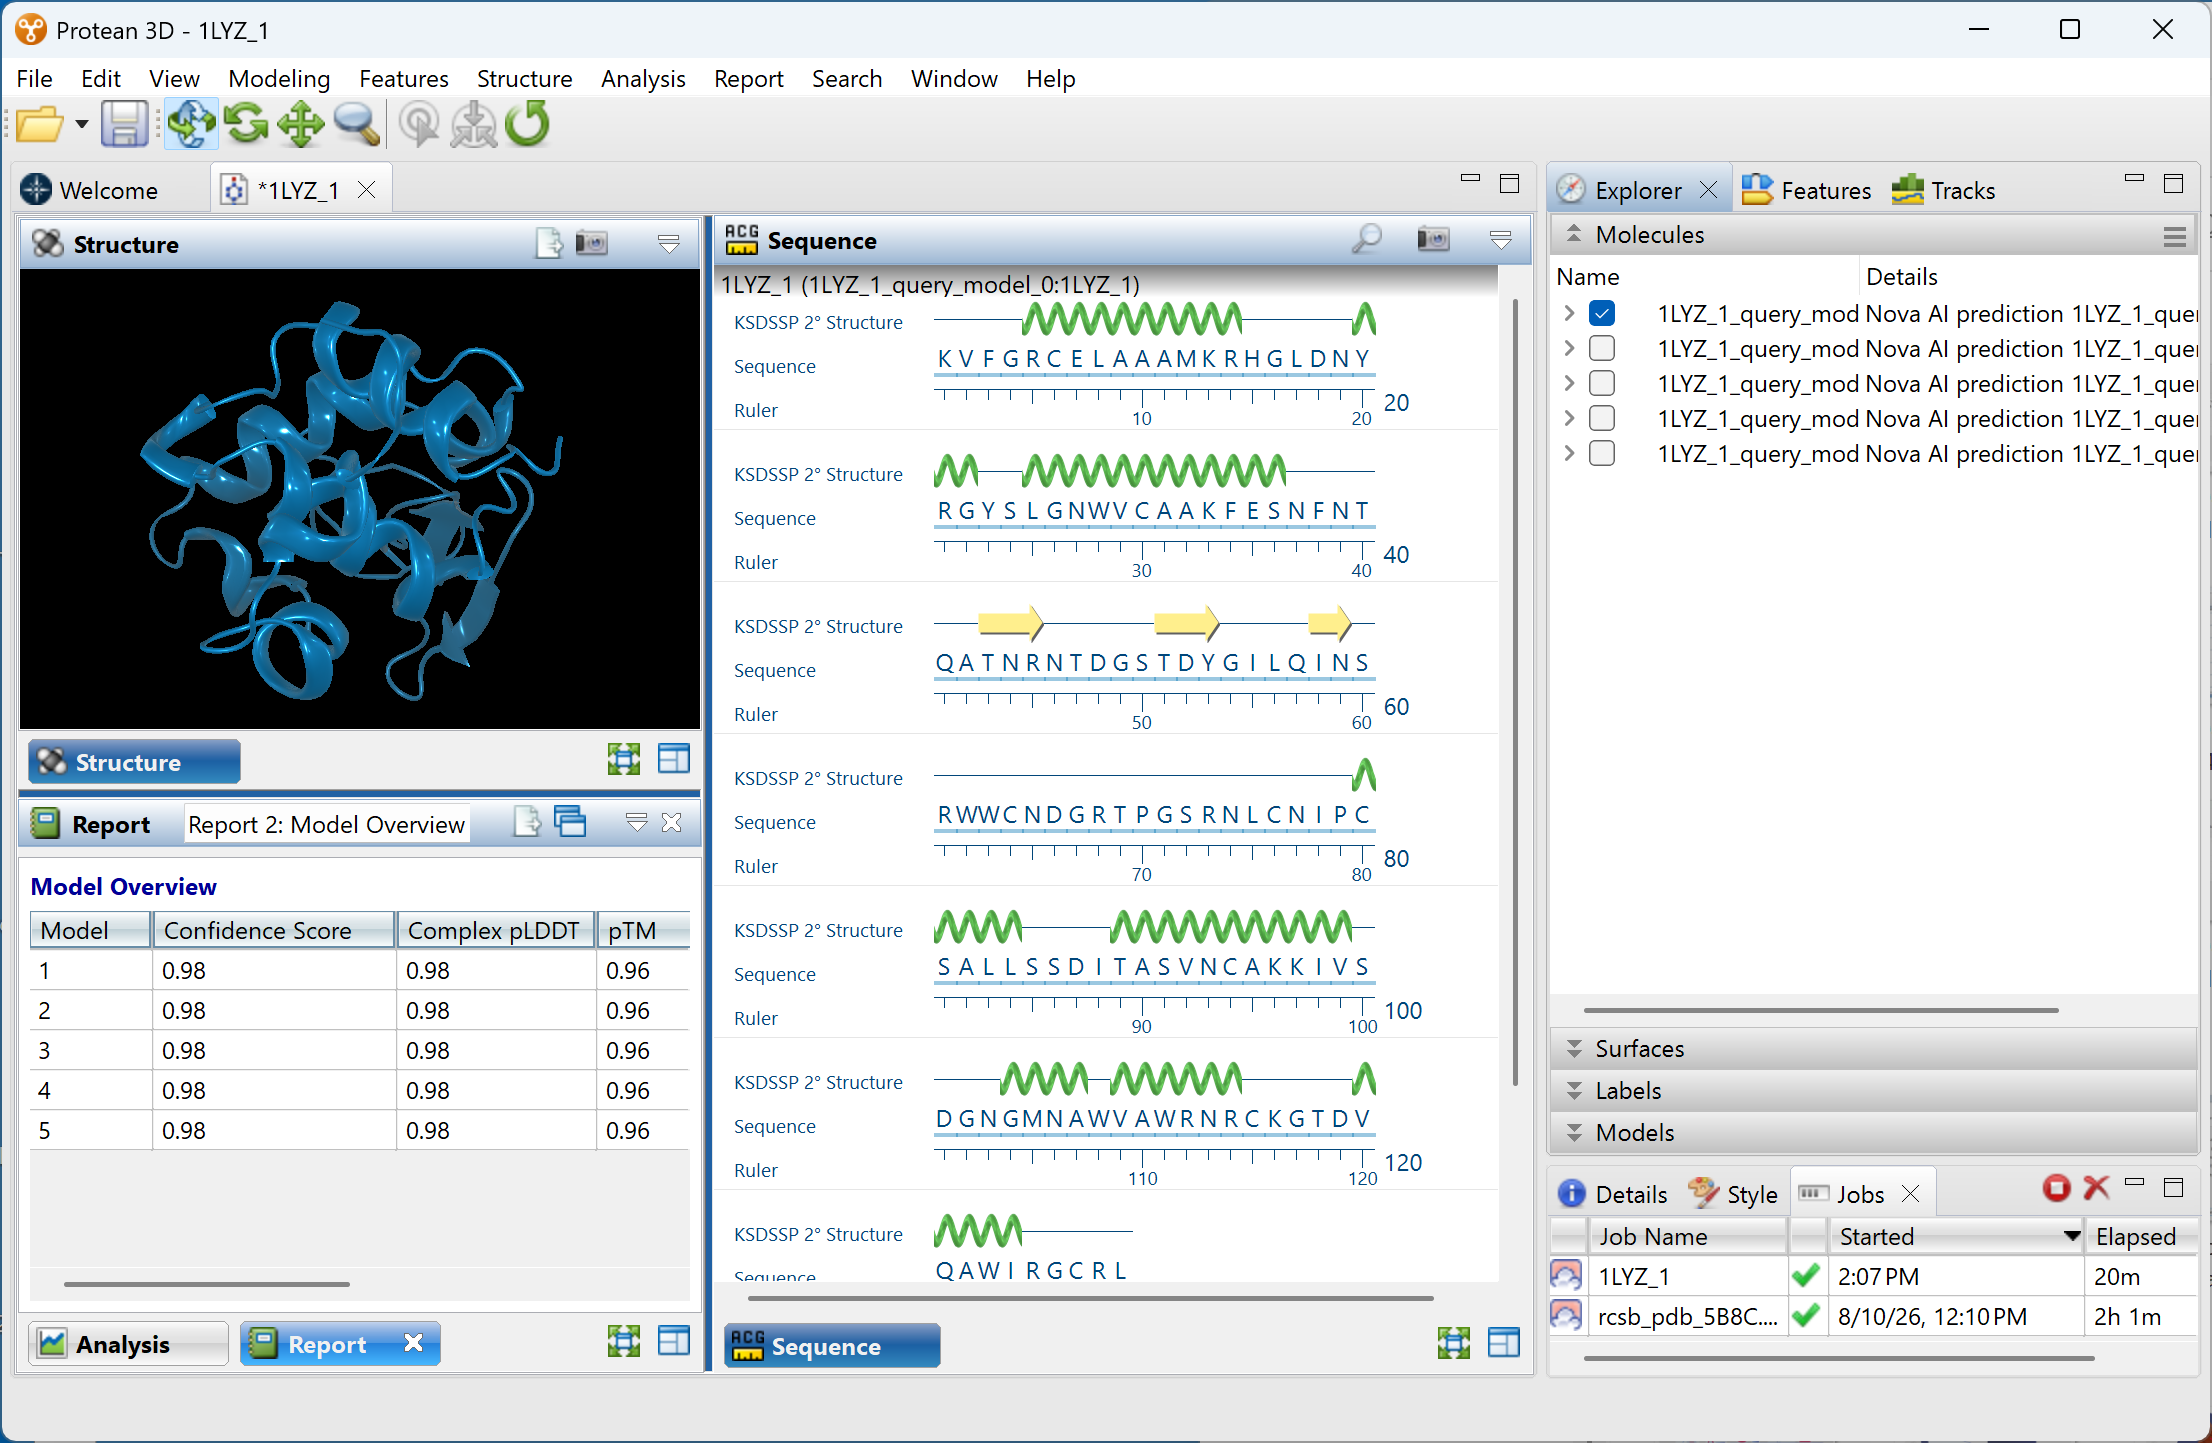
Figure 4: Protean 3D showing the highest-ranked Boltz model (top left), as well as its sequence and confidence statistics.
Next, we’ll examine some of the individual Protean 3D data displays.
Customize the display of the model in the Structure view
The Structure view provides an interactive three-dimensional representation of the predicted model that can be customized and exported as a high-resolution, publication-quality image. Protean 3D’s all-in-one pipeline eliminates the need to recreate figures in separate graphics software and helps ensure that structural details are accurately represented.
This view is almost infinitely customizable:
- Use check boxes to control which structure models, chains, and/or ligands to display.
- Rotate the structure to any angle and zoom in or out
- Choose rendering styles for the backbone, side chains, and ligands
- Color the structure (or any portion of it) by structure, chain, position, confidence statistics, amino acid chemistry, or by traits like hydropathy, flexibility, cleavage sites, epitopes, and many more
- Apply molecular or solvent-accessible surfaces
- Adjust the angle, brightness, and reflectivity of lighting
- Add Euclidian axes and customizable labels
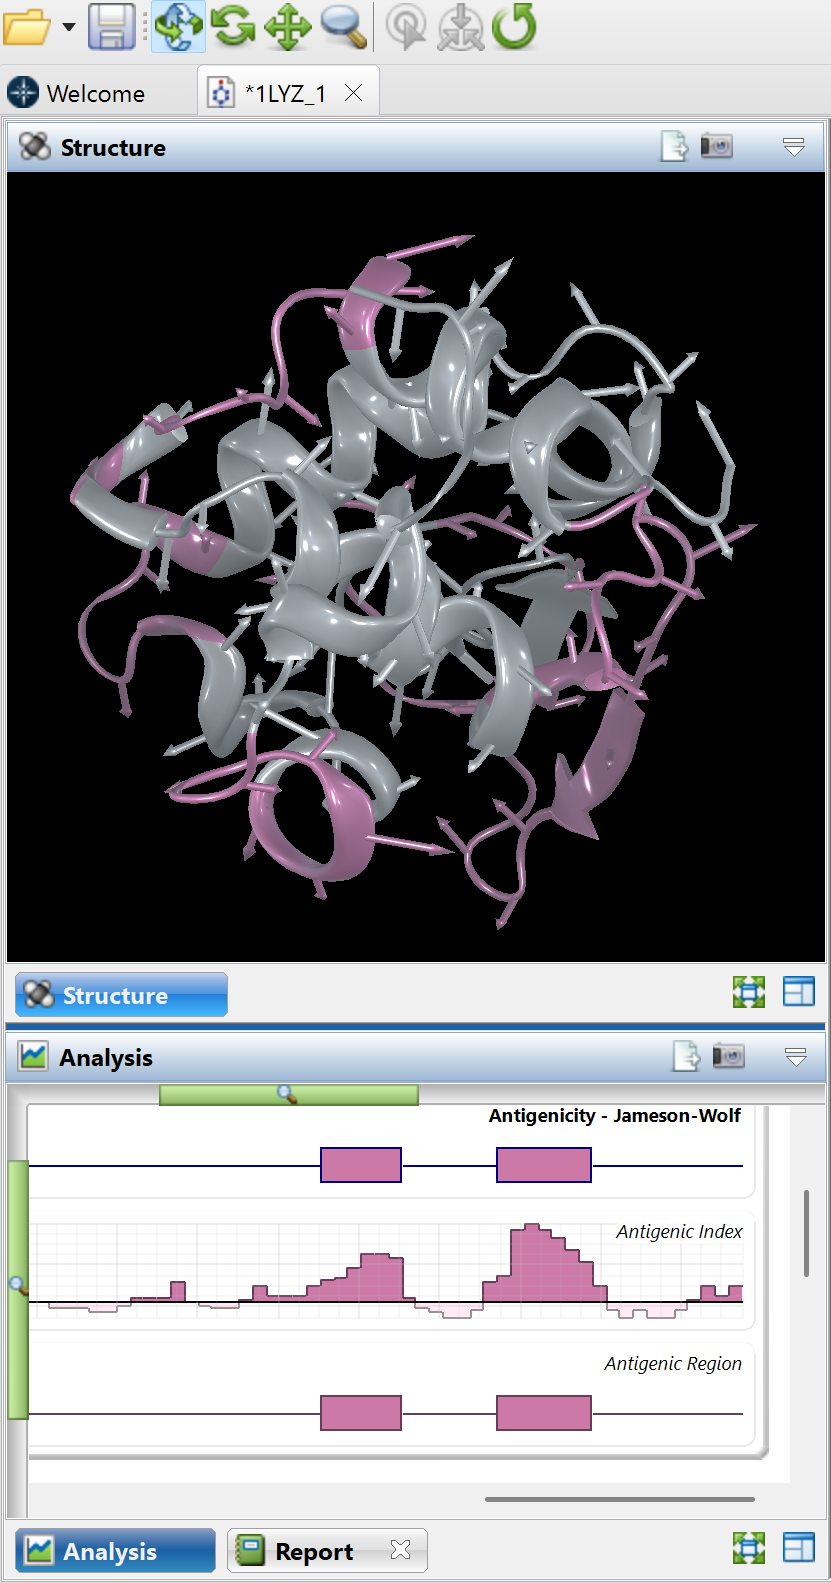
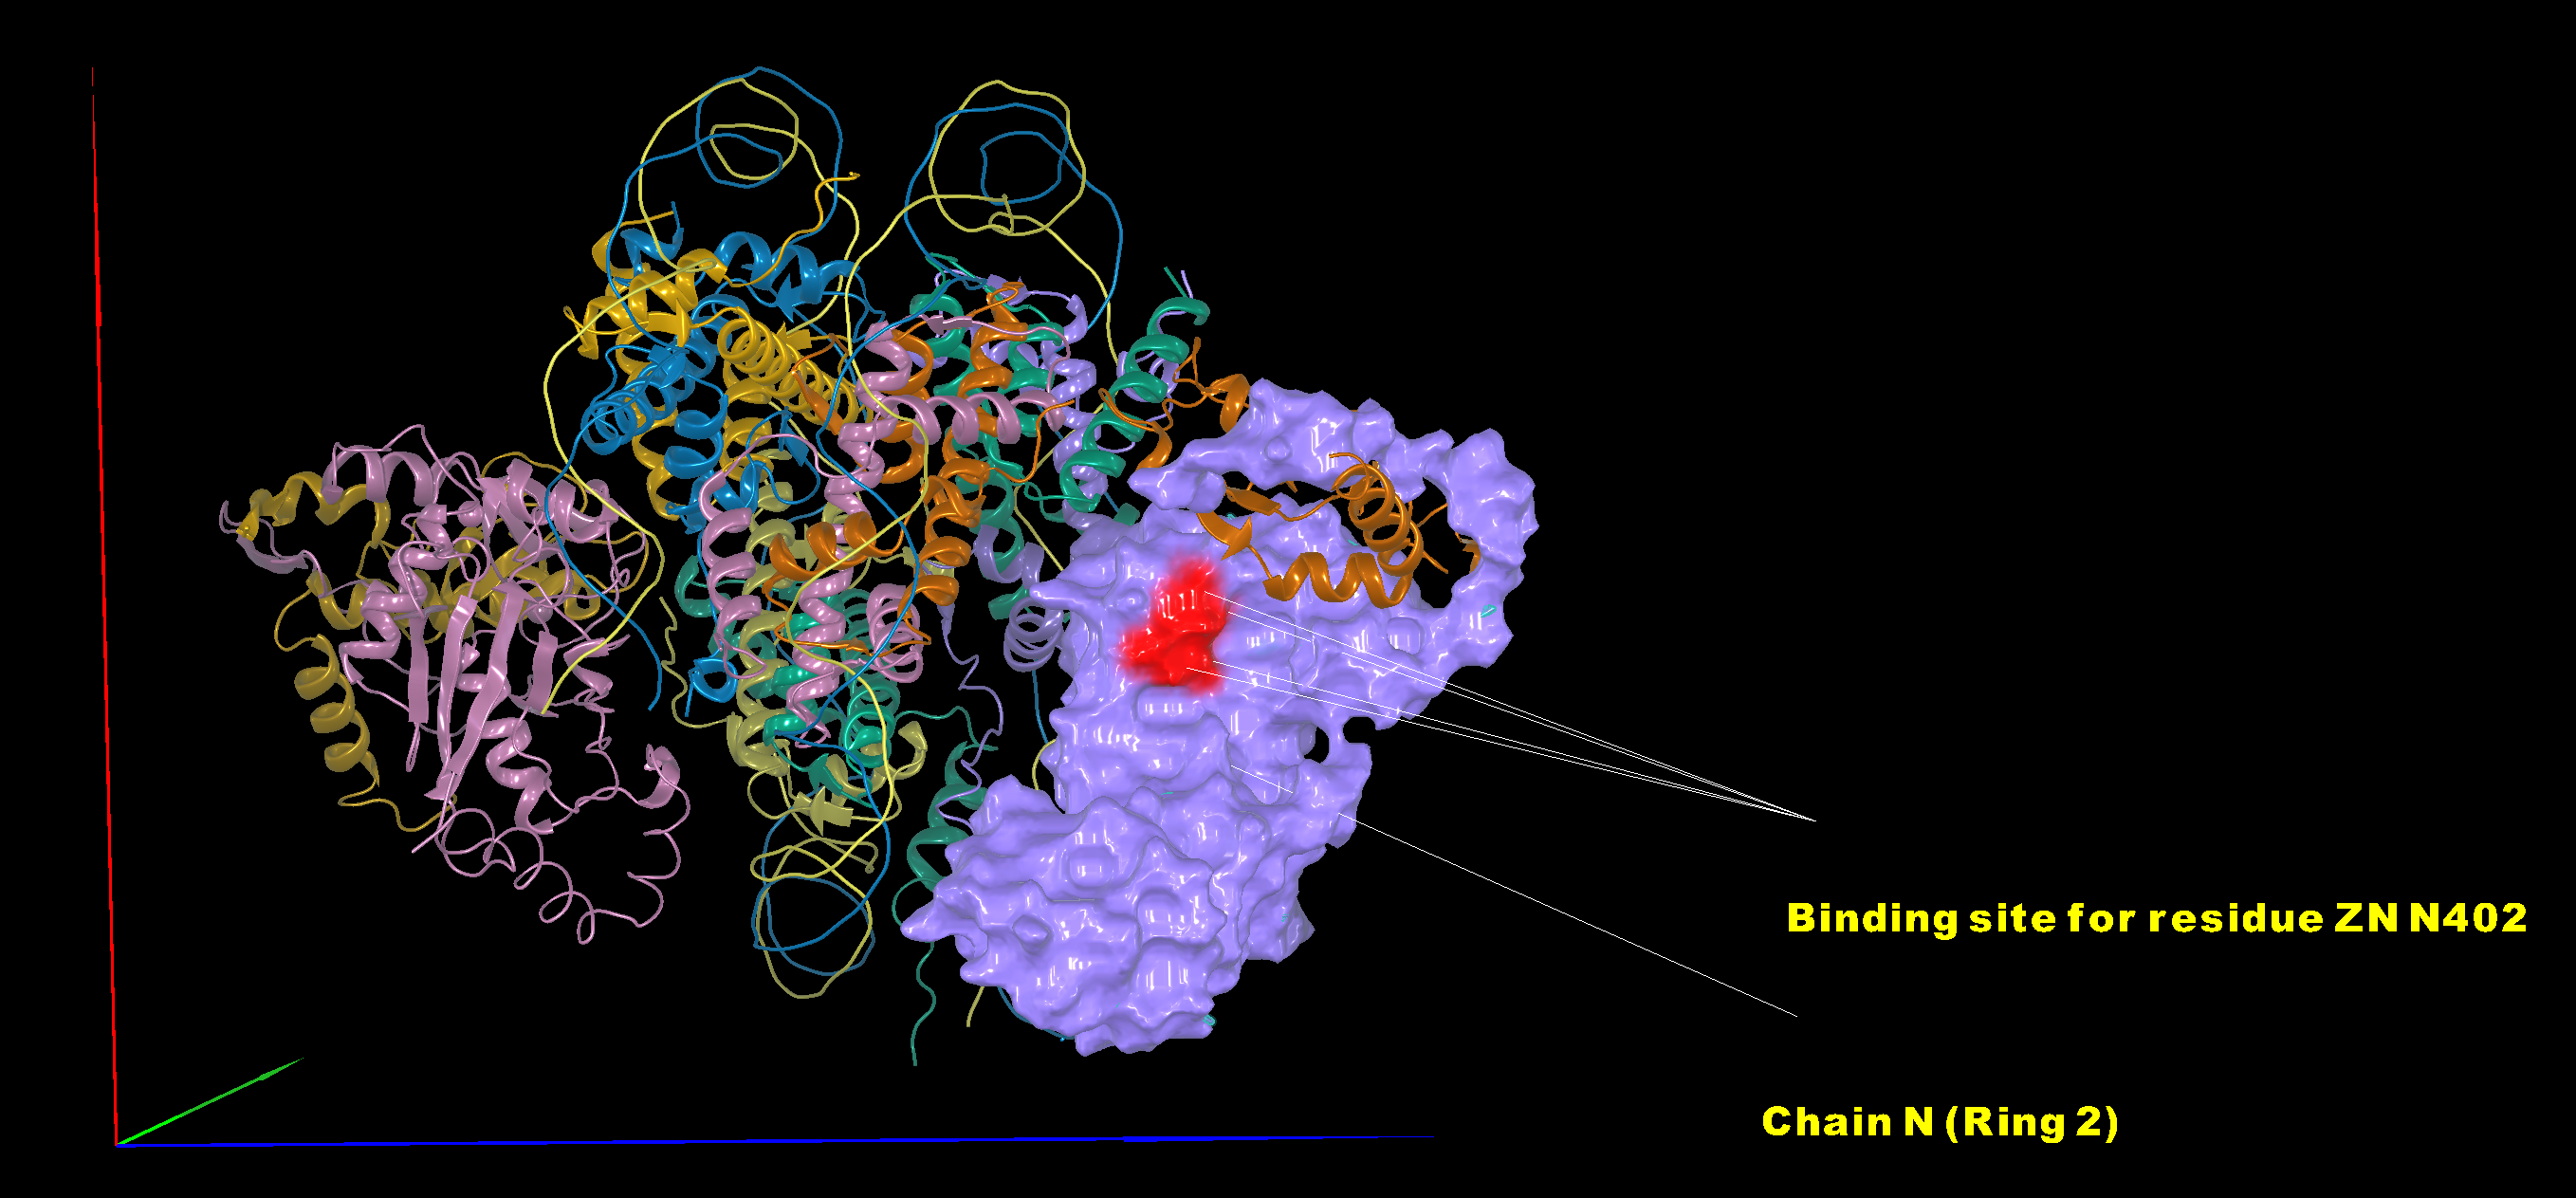
Some examples of different color schemes and renderings are shown in Figures 5-7.
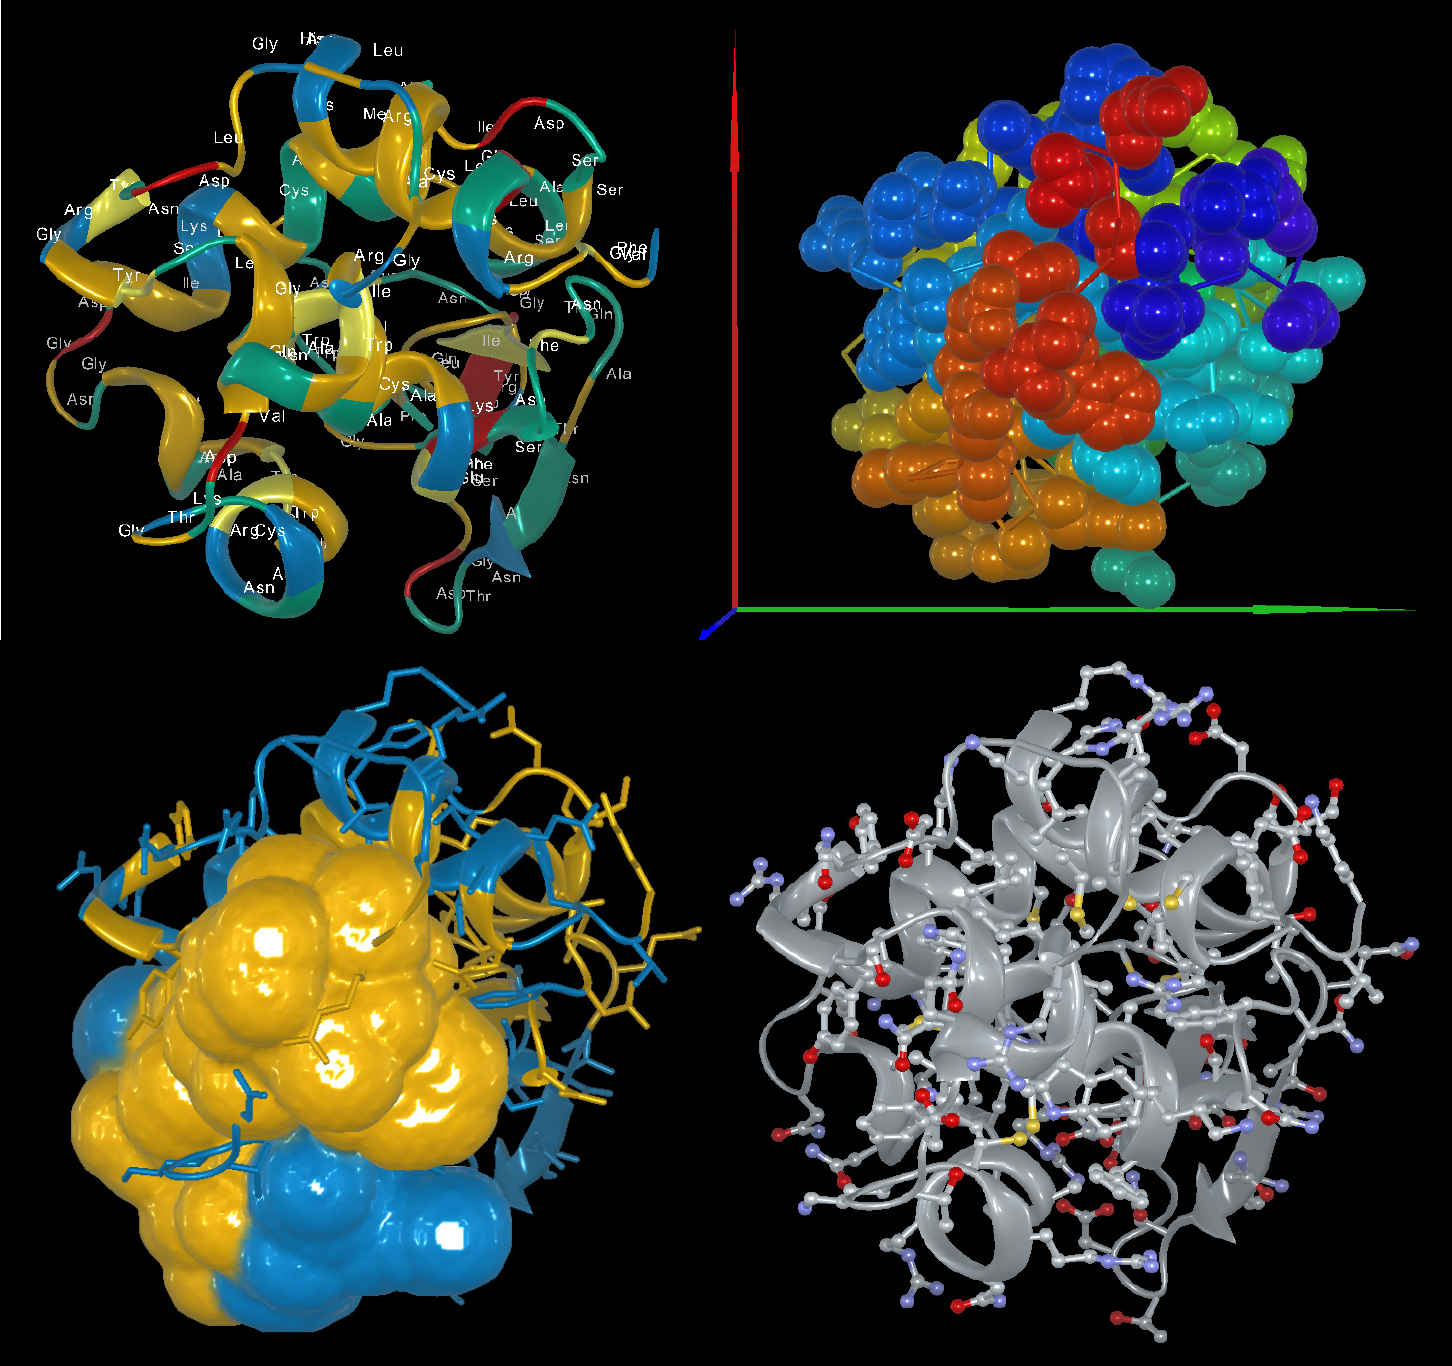
Figure 5. The top-ranked Boltz model for 1LYZ with several example color schemes and rendering styles applied.
Figure 6: At right, the image in the Structure view has been colored to match the “Antigenecity – Jameson-Wolf” track in the Analysis view below it. Regions predicted to be antigenic are displayed in pink. The tools for rotating and zooming in on the structure are visible at the top of this image.
Figure 7: The large 14-chain structure below was automatically colored by chain and a molecular surface was applied to Chain N. The binding site for residue ZN N402 was colored red to make it stand out. Labels were added showing Chain N and the binding site, and a Euclidean axis was added to show the orientation of the view. The entire customization process took about two minutes.>
Visualize a selection across multiple views
Protean 3D links structural visualization with the underlying amino acid sequence, allowing you to move seamlessly between sequence and structure.
Selecting residues or a feature within the sequence highlights their corresponding locations in the three-dimensional model (Figure 8), while selecting regions of the structure identifies the associated amino acids. This integration simplifies the investigation of active sites, conserved residues, mutations, binding interfaces, and other functionally important regions.
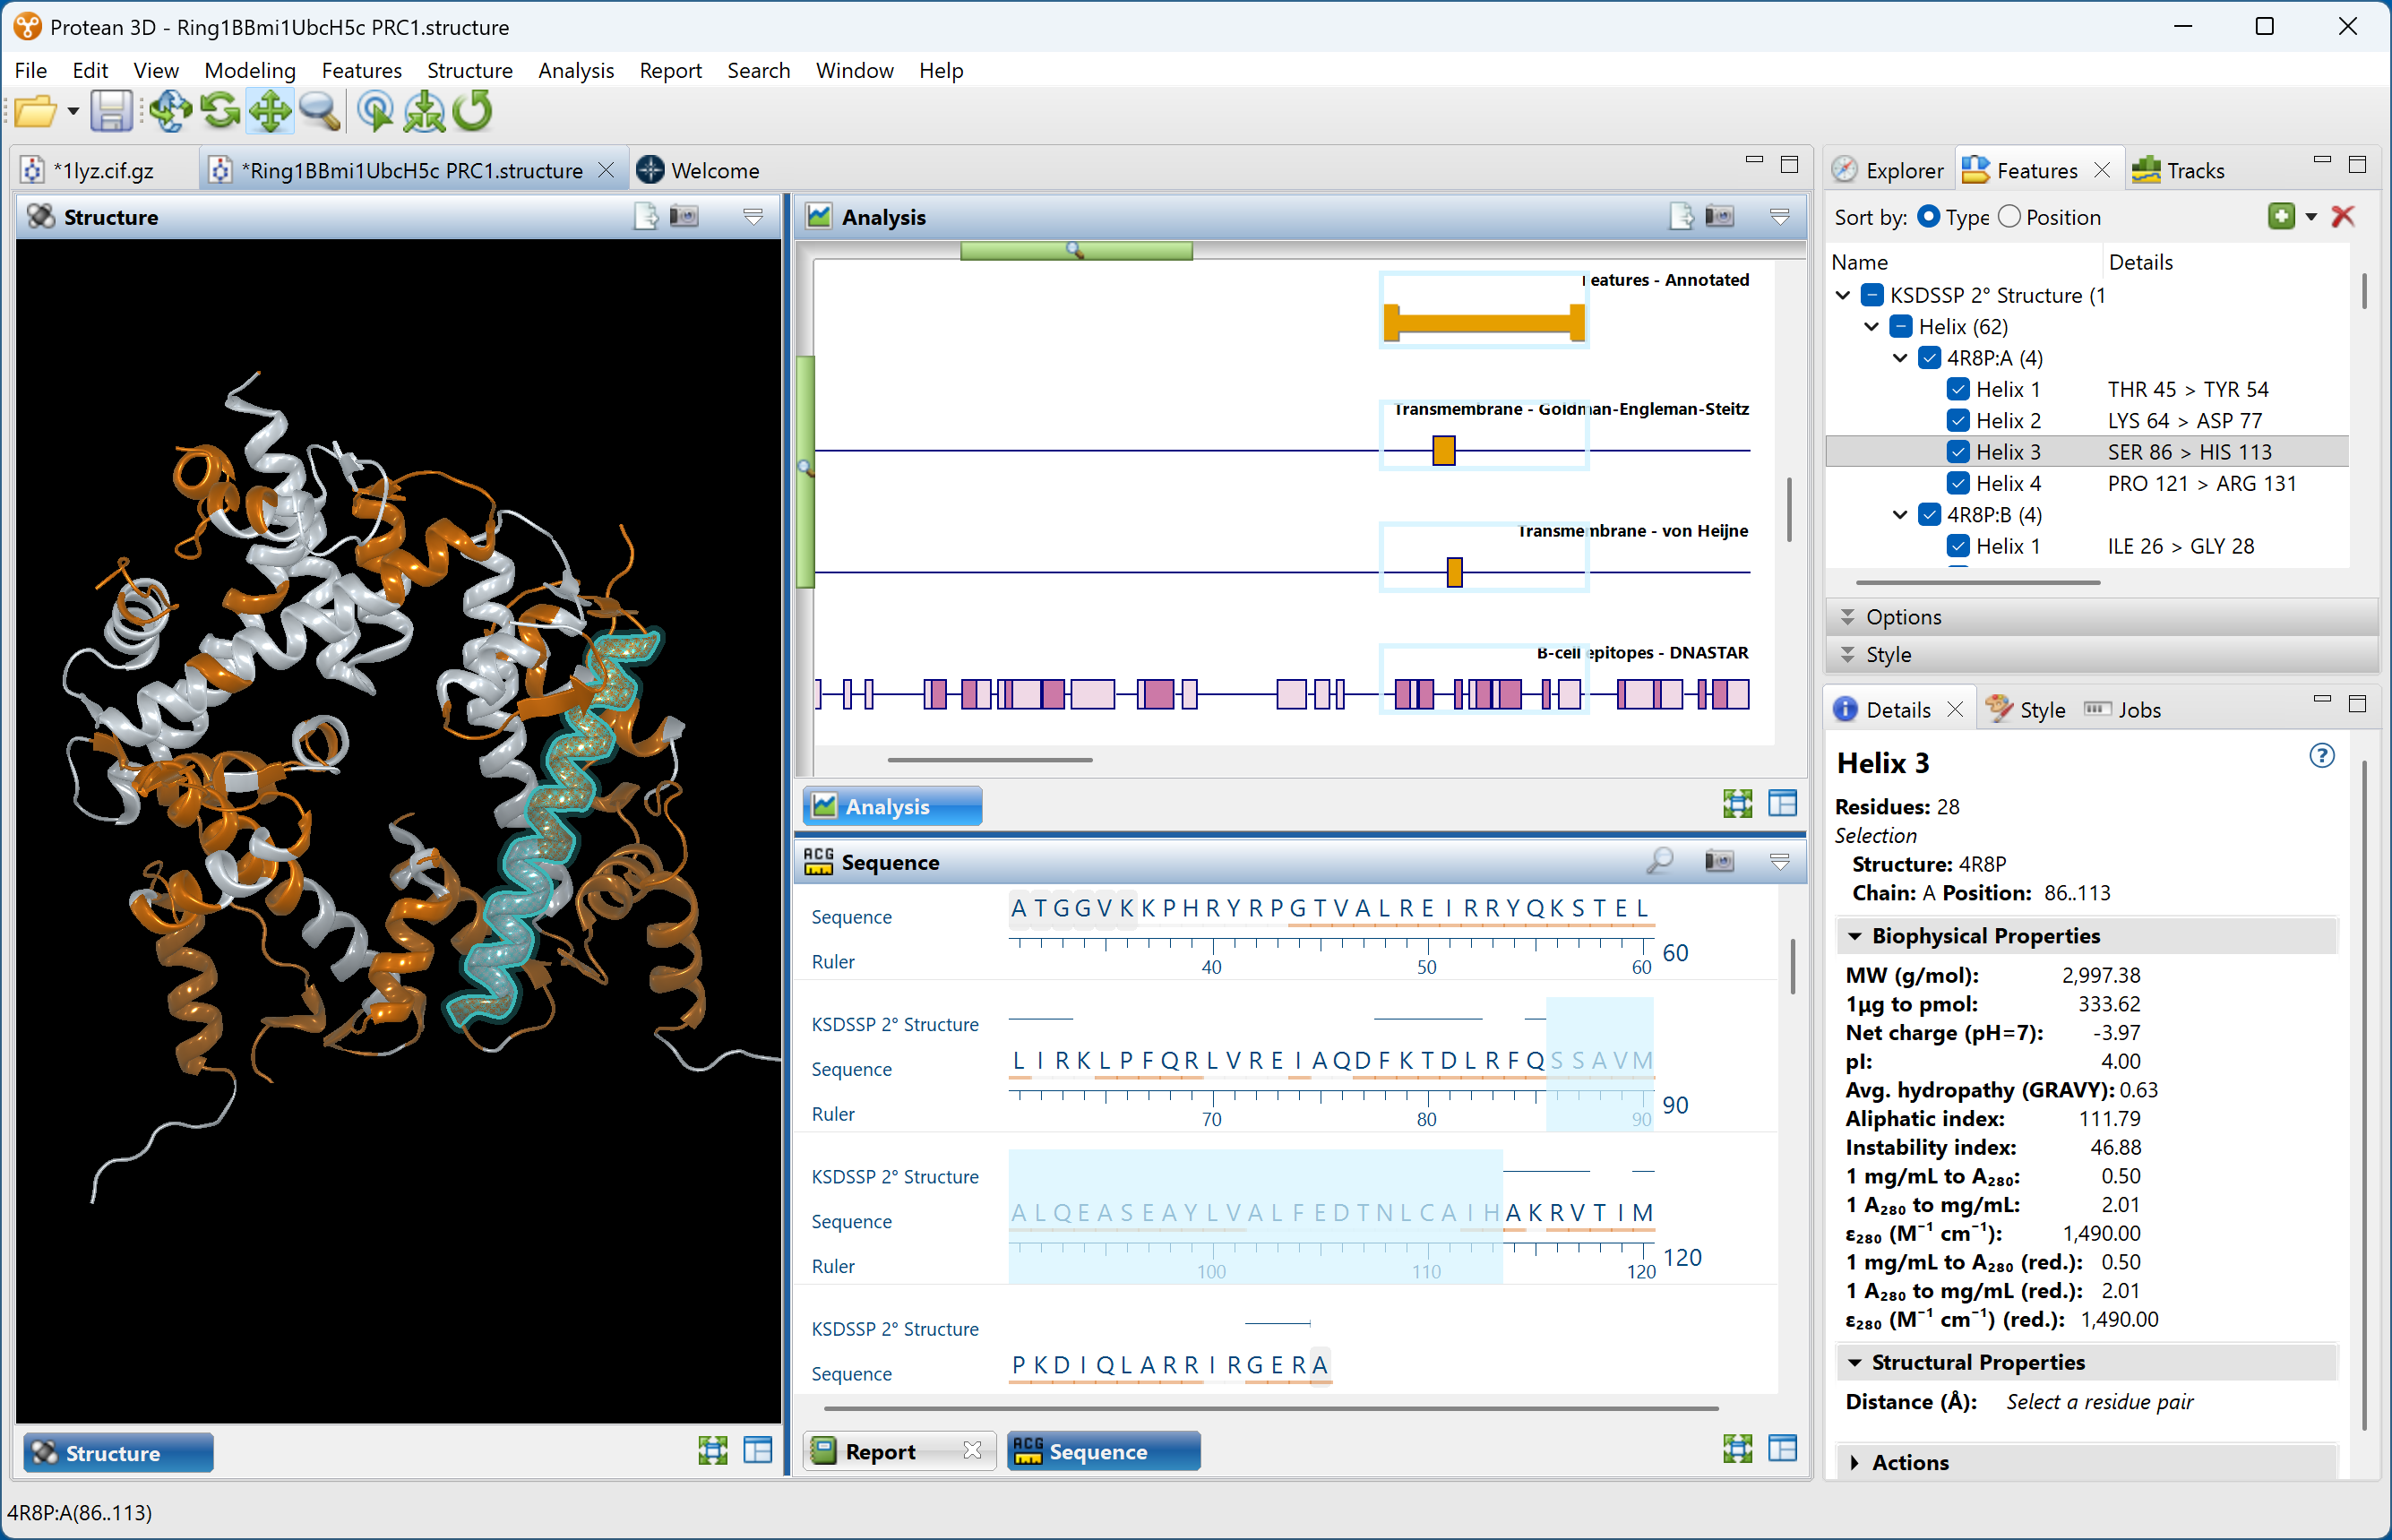
Figure 8. When “Helix 3” was selected in the Features pane (top right), this region is simultaneously selected and highlighted in the Structure view (left), Sequence view (middle bottom), and Analysis view (middle top). The Analysis view shows that this helix contains a predicted transmembrane and predicted B-cell epitopes. Statistics related to the selection are displayed in the Details panel (bottom right).
Compare alternative Boltz predictions
Many prediction algorithms generate multiple candidate structures rather than a single model. Protean 3D allows these models to be displayed individually or overlaid in the Structure view, making it easy to identify regions where predictions consistently agree and areas where structural variability exists (Figure 9).
Highest-ranked models that closely resemble one another provide increased confidence that the algorithm has converged on a stable structural solution. Conversely, substantial differences among models may indicate conformational flexibility or uncertainty that merits further investigation.
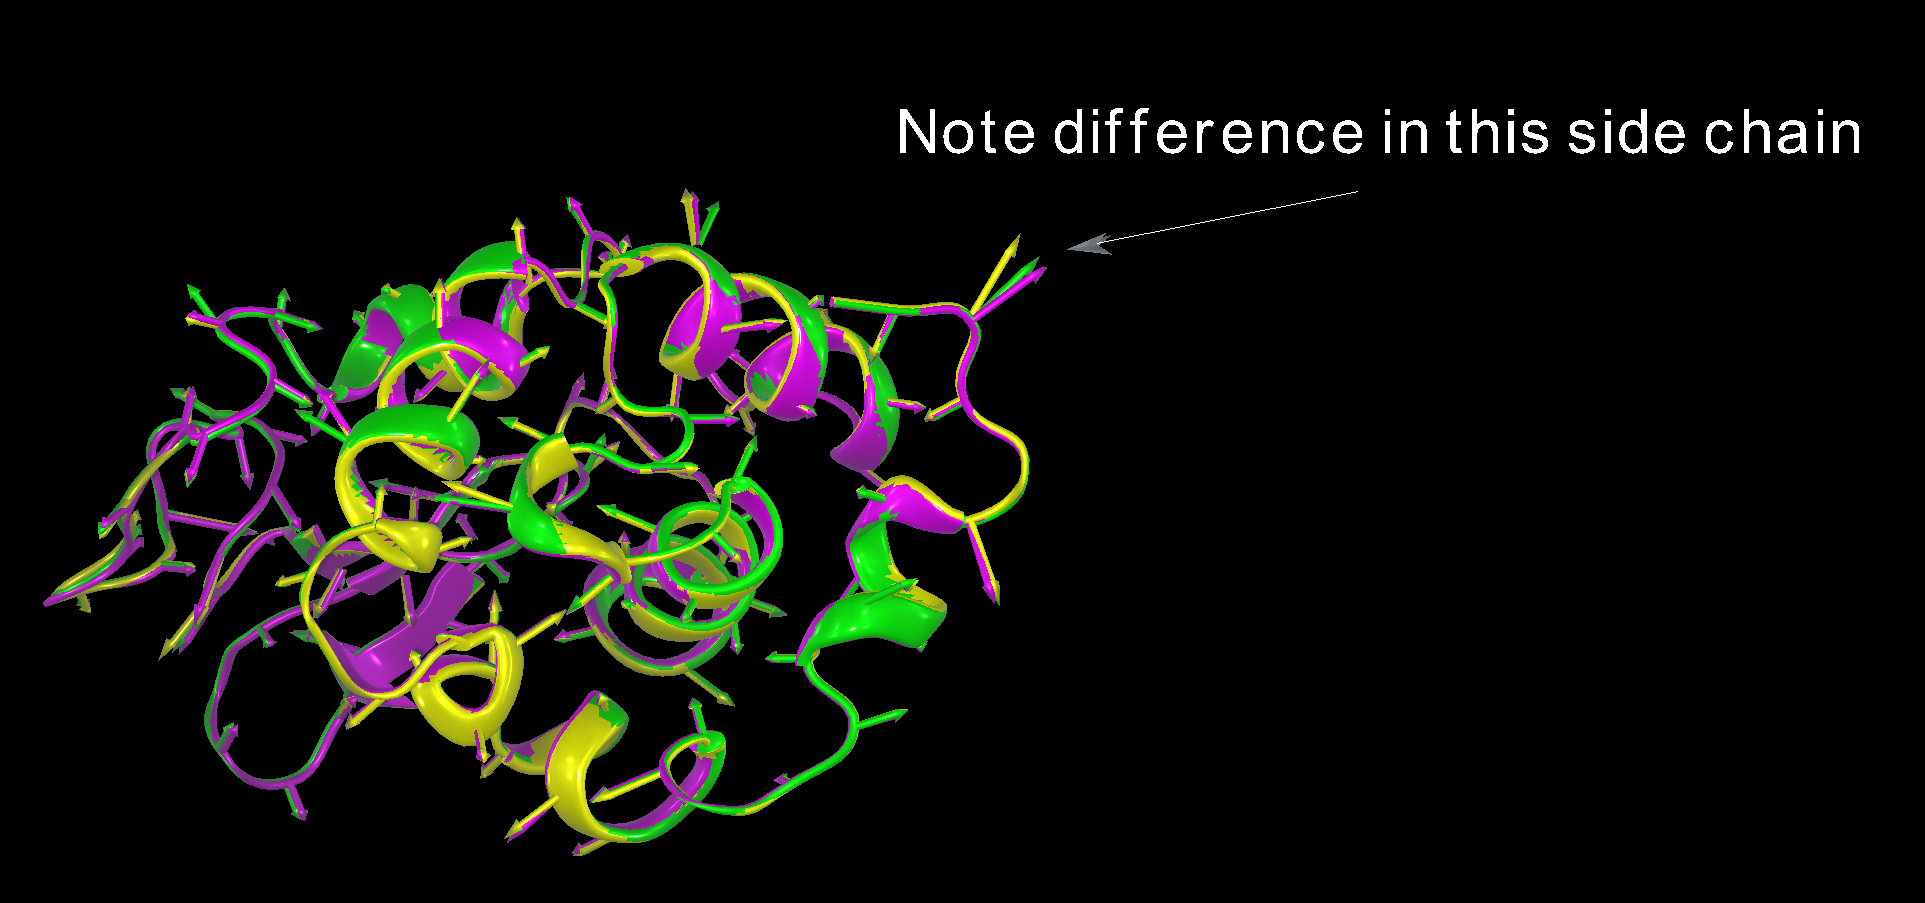
Figure 9: The top three predictions for the structure are simultaneously displayed in the Structure view, each with a different color. The predicted structures align almost perfectly except for a slight divergence in one of the side chains. The label in this image was added within Protean 3D and was exported as part of the Structure view image.
Compare a Boltz prediction to the experimentally-derived structure
Earlier in this chapter, we used a sequence file downloaded from PDB and predicted its structure using Boltz. We can now align our predicted structure with the experimentally-determined structure in just a few quick steps:
- Choose Modeling > Align Structures > Structure Alignment from the menu. A setup assistant opens.
- In the Structure screen, click the Add PDB ID button and enter the ID; in this case, 1LYZ (Figure 10).
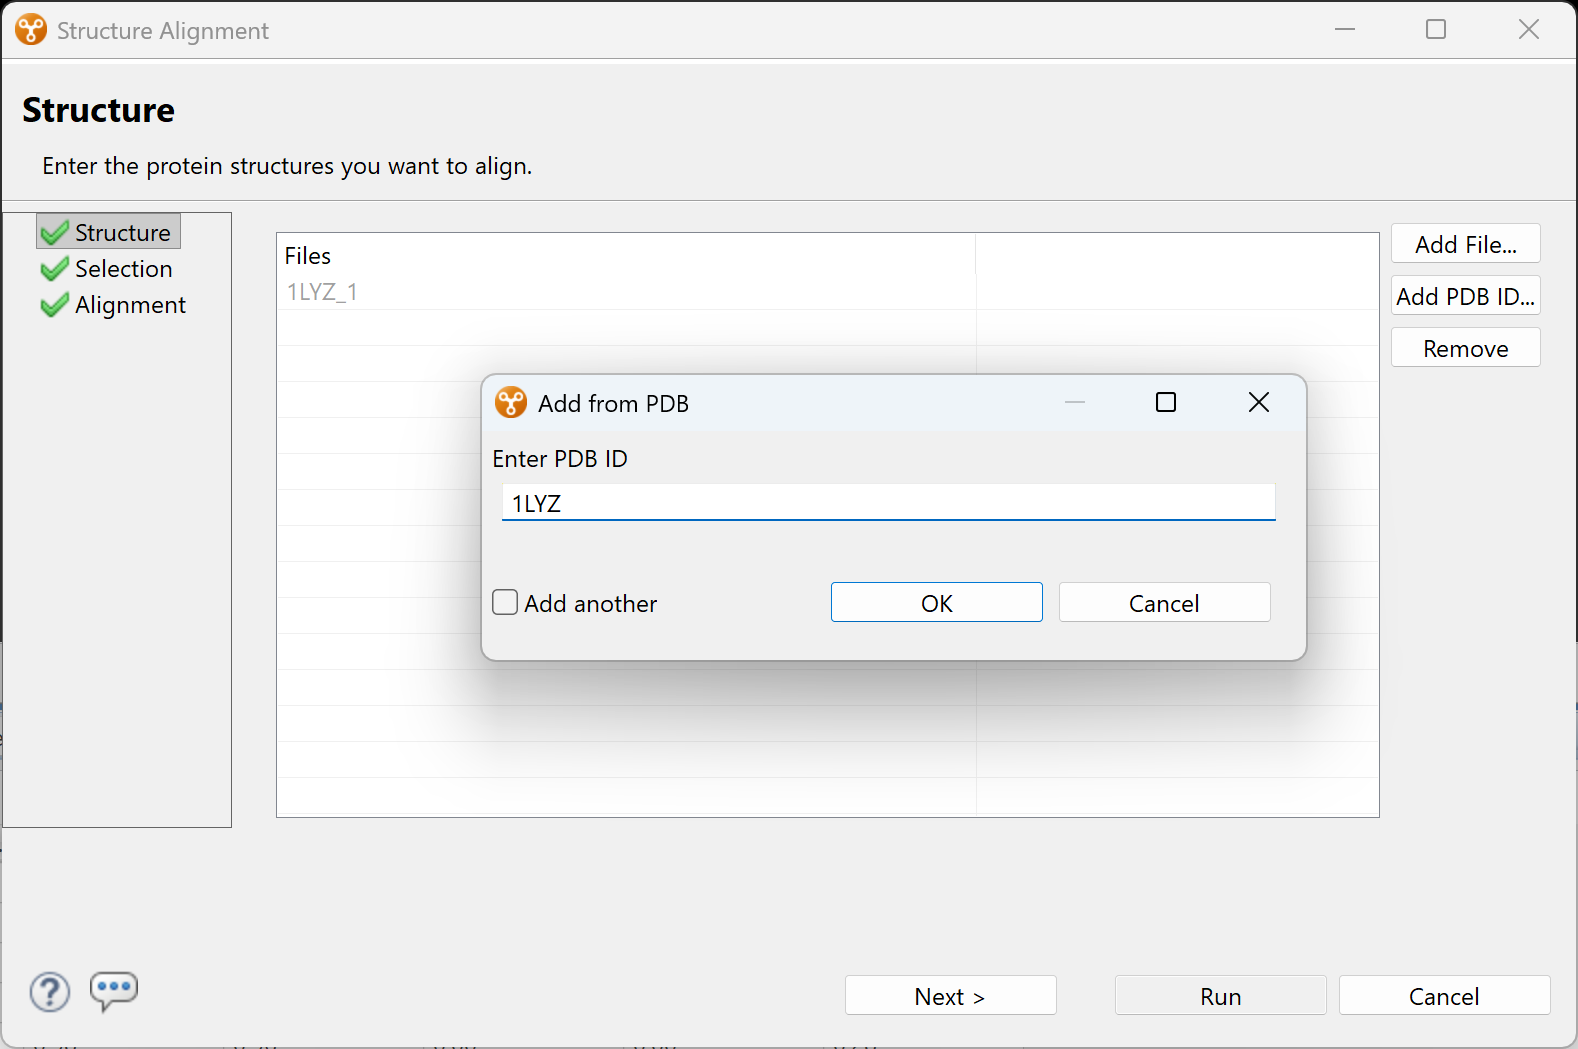
Figure 10. After clicking the “Add PDB ID” button, a popup lets you enter the desired PDB entry.
Click OK, then click Next to proceed to the Options screen.
- Chose the items you wish to align: in this case, the top prediction (Model 1) and the PDB version of the structure (Figure 11). Then click Run.
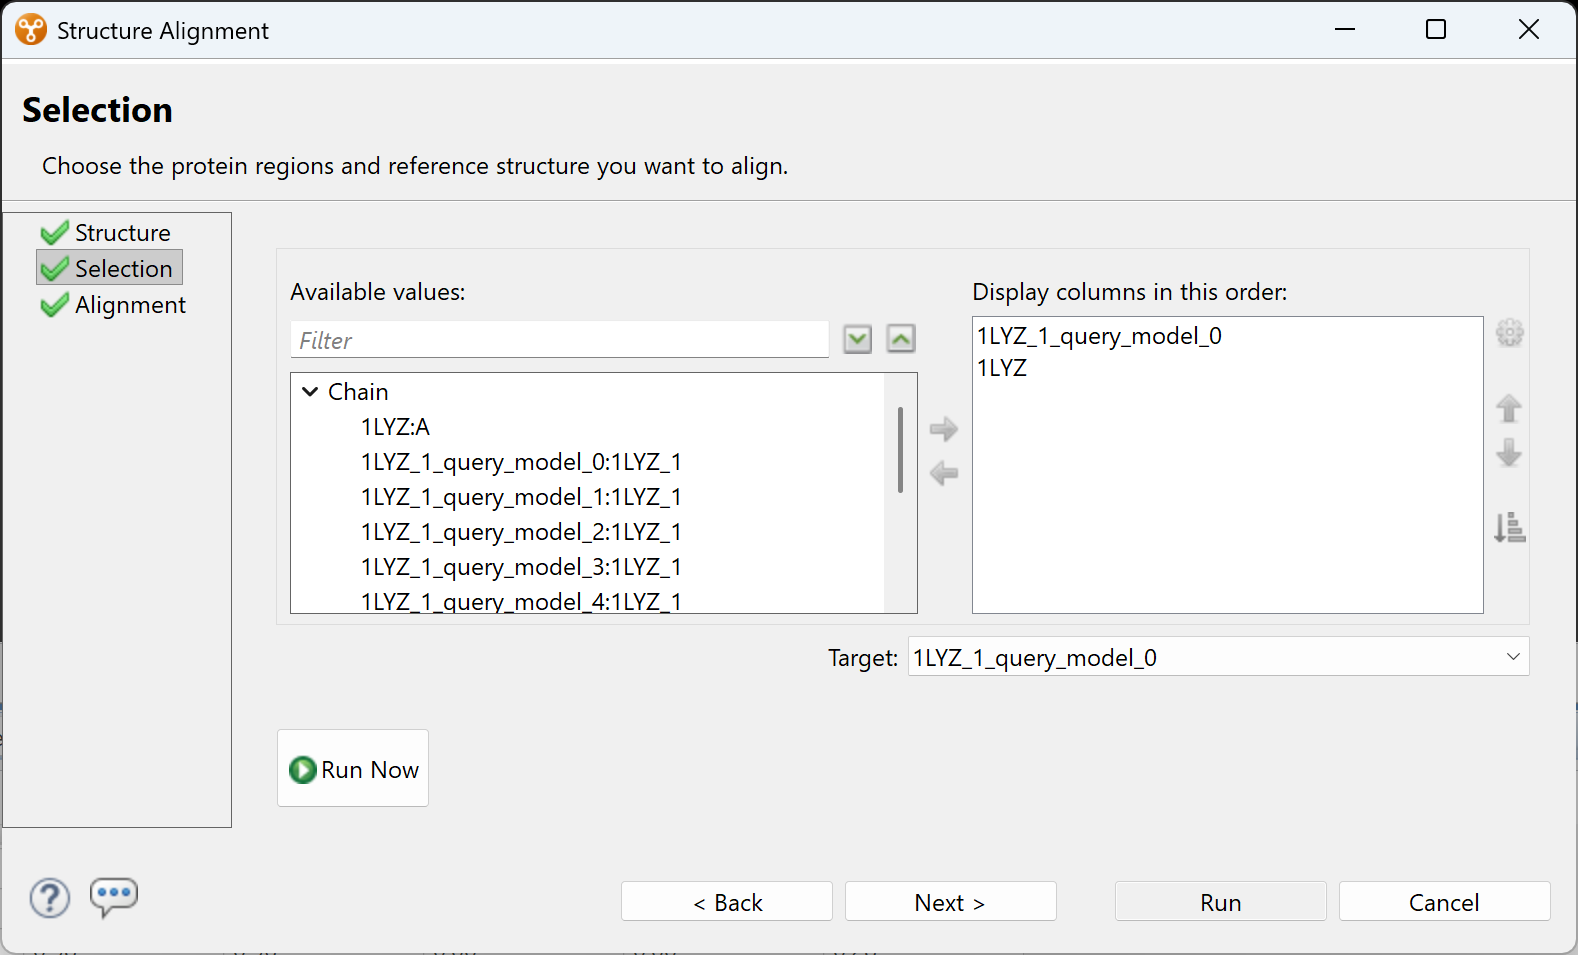
Figure 11. The two complete structures that will be aligned have been moved into the right pane. Other choices that were not chosen remain in the left pane.
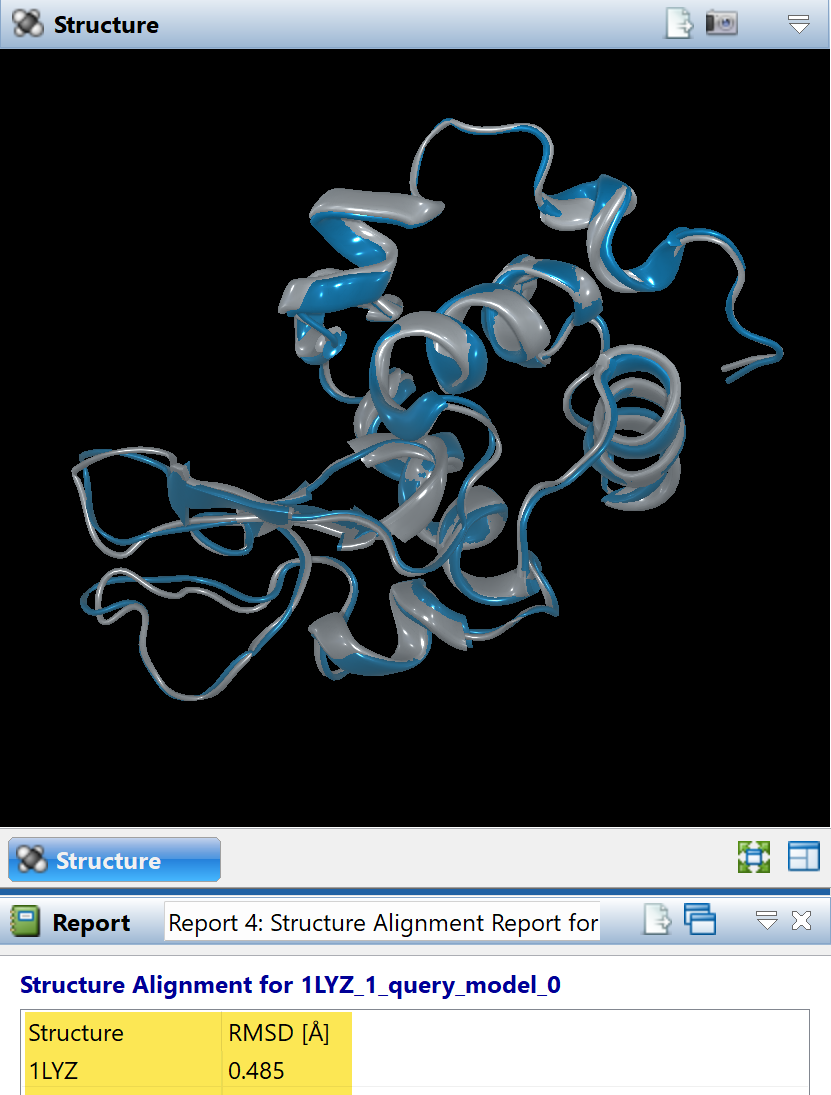
The root mean square deviation (RMSD) in Protean 3D’s Structure Alignment Report (Figure 12) provides an objective assessment of structural similarity. In this case, the RMSD was 0.485 Å indicating a nearly-identical match.
Figure 12. Protean 3D’s Structure Alignment Report shows the top Boltz prediction has an RMSD of 0.485 Å compared to the experimentally-derived structure.
RMSD (Å) Score Interpretation
< 1.0 Å: Exceptional match; typical for high-resolution experimental replicates, closely related crystal structures, or identical proteins in slightly different local environments.
1.0 Å – 2.0 Å: Good structural similarity; common for homologous proteins with the same general function or successful computational prediction models (like Boltz) compared to an experimental baseline.
2.0 Å – 3.0 Å: Borderline similarity; may share the same core fold, but divergent loops or distinct conformational changes are present.
> 3.0 Å: Poor similarity; the structures likely belong to different protein families or lack a common evolutionary fold.
Evaluate prediction confidence and other statistics
Protean 3D automatically displays confidence values for predictions using color-coded visualizations that make it easy to distinguish highly reliable regions from areas that may be more flexible or uncertain. These confidence scores often correspond closely with intrinsically disordered regions, flexible linkers, or portions of a protein that may adopt multiple conformations.
Viewing confidence values directly on the three-dimensional structure allows you to quickly identify which structural features can be interpreted with the greatest confidence and which may warrant additional experimental investigation. Figure 4 (higher up this page) shows the prediction in solid blue, indicating the highest confidence for the entire structure.
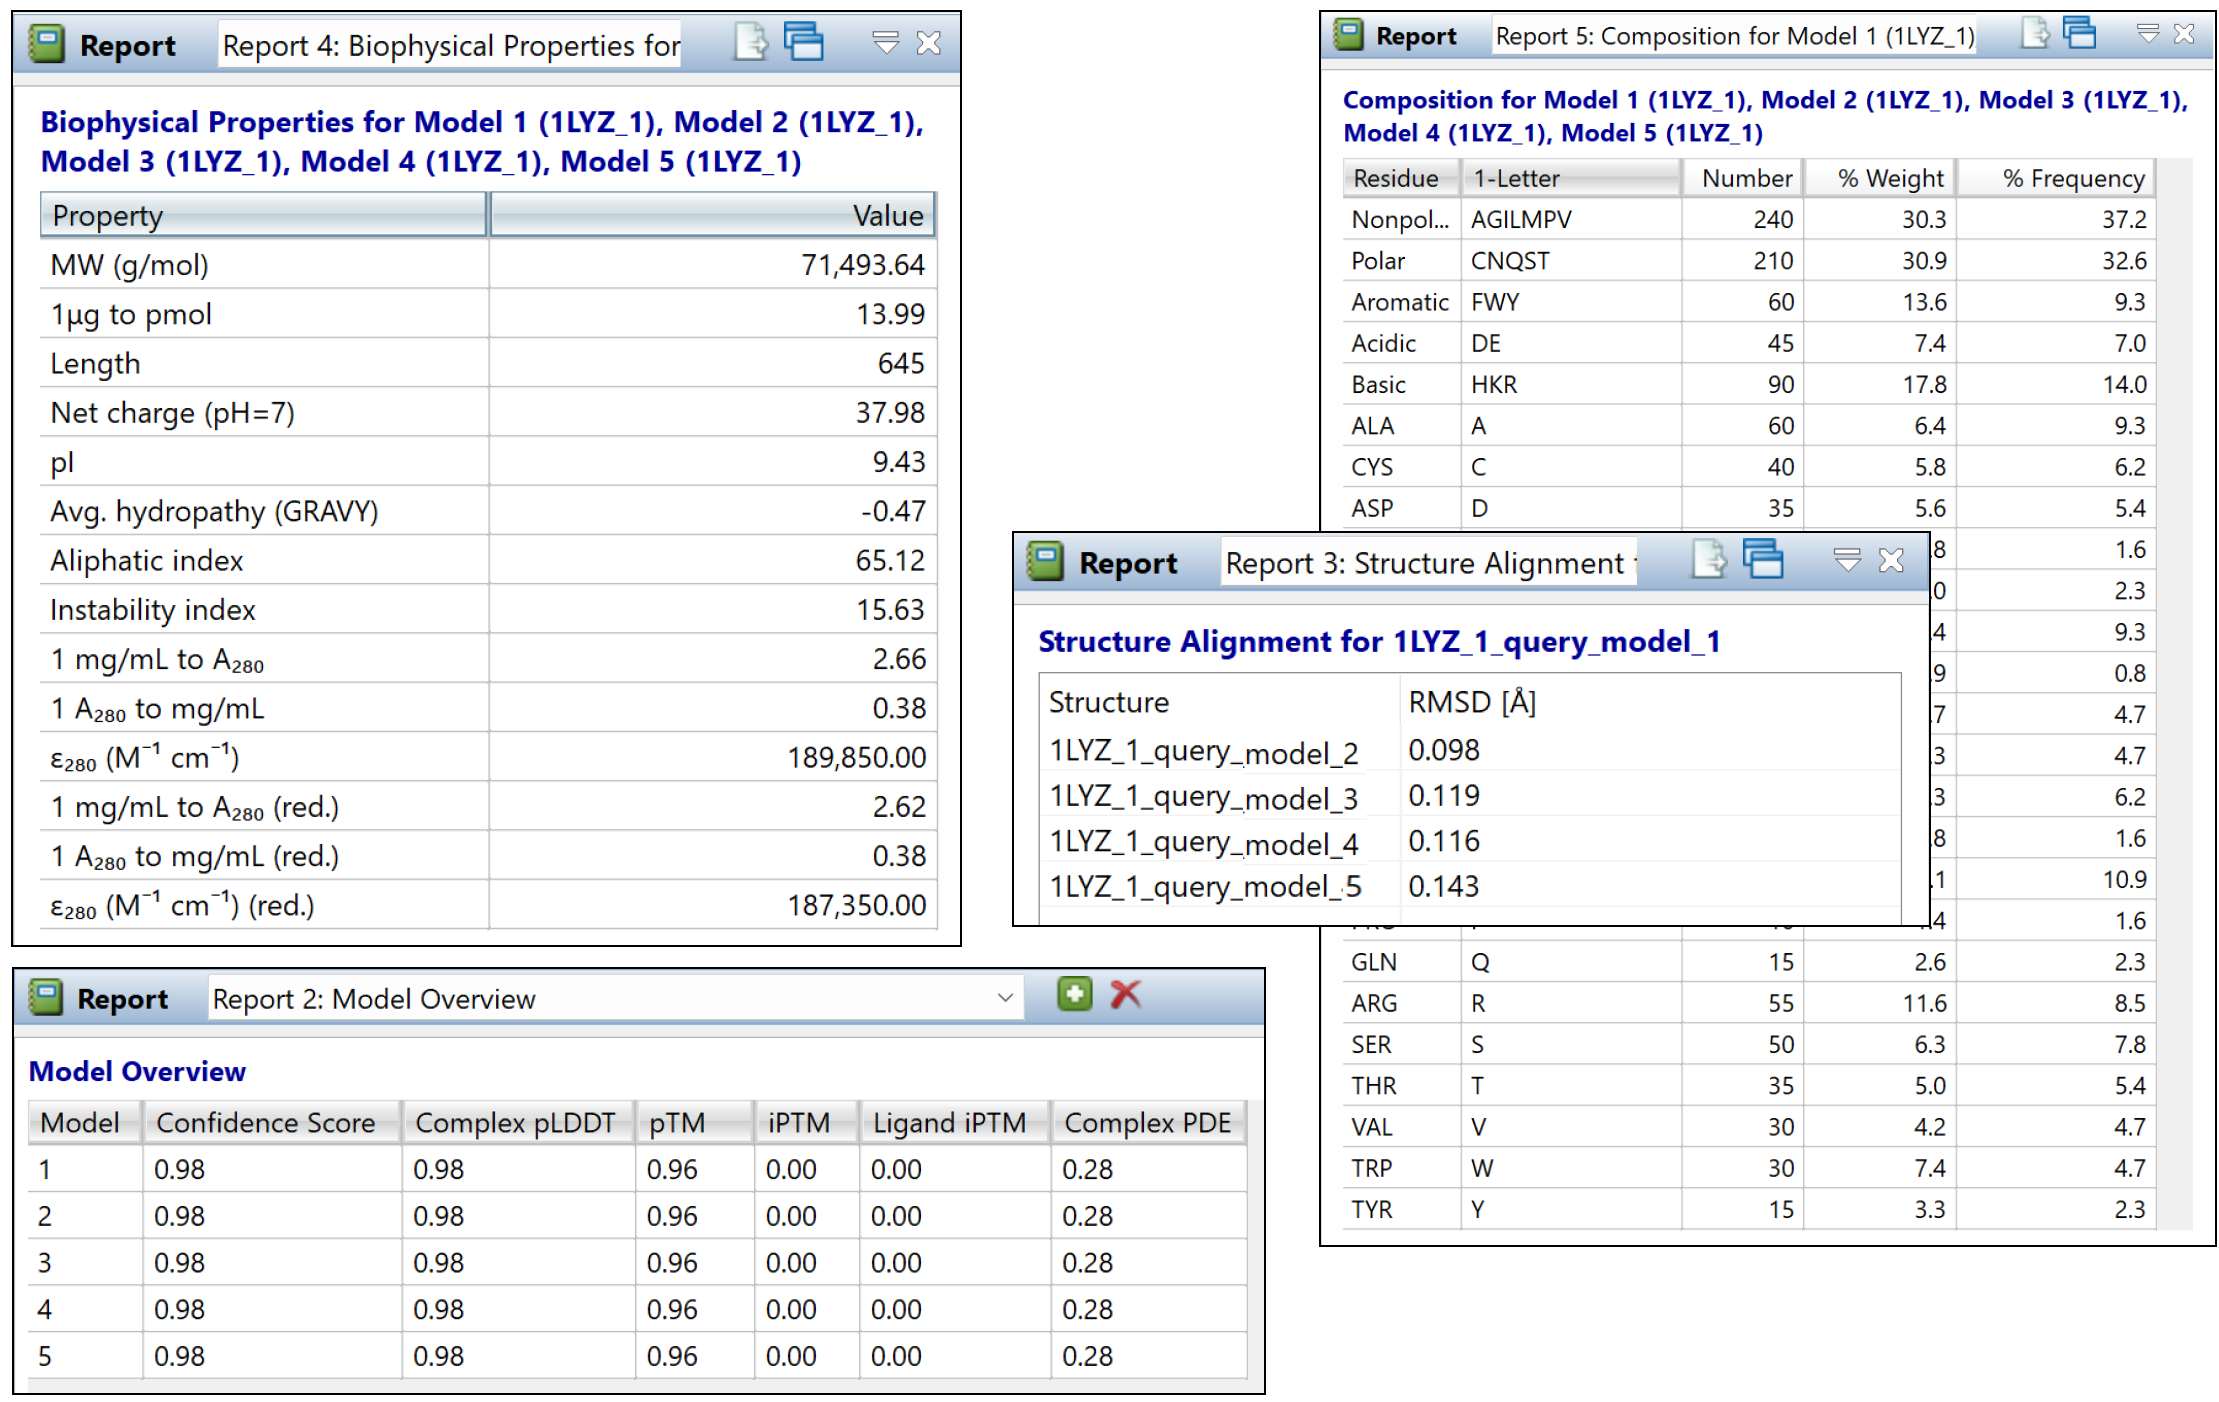
Protean 3D also provides additional reports summarizing important characteristics of each prediction (Figure 13). Depending on the prediction method, these reports may include information such as:
- Prediction confidence
- Model ranking
- Chain composition
- Biophysical properties
These reports provide an objective overview of each prediction and are particularly useful when comparing multiple prediction runs.