
The Analysis view shows tracks for a single sequence. The view is empty unless the session contains only one sequence; or until a single sequence has been chosen in the Overview or by using the navigation tools or Places panel bookmarks. At that point, the Analysis view appears automatically and is populated with data.
To access the Analysis View at any time, click on the Analysis tab, the dark blue tab in the image below, or use View > Analysis.
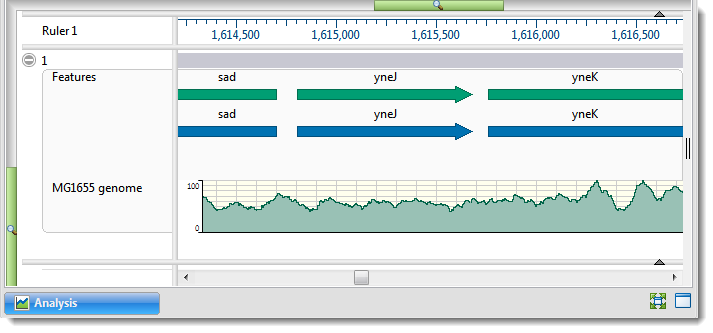
By default, the Analysis view displays a header and footer, along with a sequence and its corresponding data tracks. The Analysis view has a different appearance depending on the zoom level. See the lowermost table on Customize the appearance and layout of views for examples.
To export an image of a view, use the Export image tool ( ) in the top right corner of the view.
The following table shows ways to customize the Analysis view:
| Task | How To |
|---|---|
| Change the color scheme, font, or layout | Use the Style panel’s Sequence section and/or Analysis section. |
| Show the header & footer | Click on the small dark gray arrows near the upper right corners of each section.  |
| Hide the header & footer | Click on the small dark gray arrows near the upper right corners of each section. |
| Show a vertical guideline | Click Analysis > Show Guideline. The presence of a check mark directs GenVision Pro to display the guideline. A vertical guideline is displayed by default, and is a navigational aid to help in guiding your eye between sequences and tracks.  |
| Hide a vertical guideline | Click Analysis > Show Guideline. The absence of a checkmark means that only an abbreviated version of the guideline will remain visible in the header and footer. |
Need more help with this?
Contact DNASTAR